ROADSIDE REVEGETATION
An Integrated Approach to Establishing Native Plants and Pollinator Habitat

3.8 Identifying Limiting Factors to Plant Establishment
Site conditions that affect plant establishment and growth are referred to as limiting factors (Figure 3-10). Odum (1971) defines limiting factors as "any condition which approaches or exceeds the limits and tolerance (of a plant species)." He further states that "the chief value of the concept of limiting factors lies in the fact that it gives the ecologist an 'entering wedge' into the study of complex situations. Environmental relations of organisms are apt to be complex, so that it is fortunate that not all possible factors are of equal importance in a given situation or for a given organism." Not only does this simplify a complex analysis, it requires the designer to systematically consider all site factors, focusing on those of greatest concern. For example, typical revegetation treatments conventionally call for the blanket use of fertilizers without assessing if nutrients are really limiting to plant growth. In many cases, other limiting factors to revegetation, such as low rainfall, compacted soils, low organic matter, and poor rooting depth, are more limiting. Applying fertilizer without an assessment of limiting factors, is like a physician prescribing medicine before the patient has been properly diagnosed. While soil fertility is often important on many highly-disturbed sites, it might not be the primary limiting factor to revegetation on this particular site.
For the designer
Defining the limiting factors is an essential process in developing a revegetation plan because it identifies, from a multitude of site factors, only those that are roadblocks to successful revegetation. A Limiting Factor table is available in this Planning workbook.
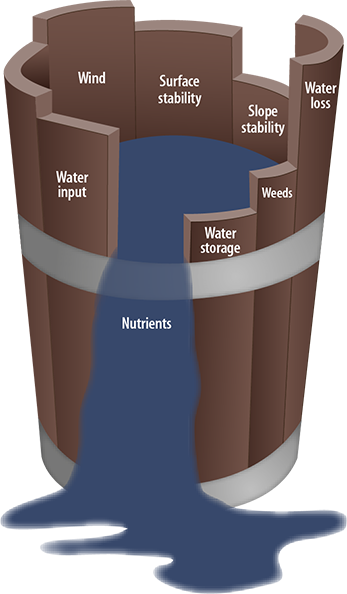
Figure 3-10 | Limiting factors to revegetation
Limiting factors to revegetation can be displayed as unequal boards of a barrel. Water can only be held to the level of most limiting factor.
This manual has grouped the site characteristics essential for plant growth into six limiting factors to revegetation typically encountered in the United States. These factors are further broken down into component parts, or parameters (Figure 3-11). In this section, each limiting factor to revegetation and corresponding parameters are discussed in terms of why they are important to plant establishment and growth, how they are assessed, and what mitigating measures or treatments can be applied to make them less limiting.
The information used in defining limiting factors for each revegetation unit can be obtained from the surveys and reports conducted during the field surveys. It is important that an assessment of every limiting factor and corresponding parameter be made for each revegetation unit based on the expected condition of the site after road construction. Figure 3-11 can be used as a checklist—a means of quickly assessing a site for its potential to grow plants while preventing the possibility of overlooking factors important for successful revegetation. Much like pilots or surgeons use checklists, the designer can use the limiting factors list to simplify a "complex situation" and quickly identify what is important from what is not.
From the limiting factors identified for a project, a list of mitigating measures is developed. Mitigating measures are the site treatments that will reduce or eliminate the site conditions limiting to revegetation. For example, if rainfall is limiting, a mitigating measure is to irrigate. There are usually several ways to mitigate each limiting factor. While some of the mitigating measures might seem impractical for a particular revegetation project, they are at least considered.
How to approach this chapter—This chapter is organized by limiting factors. It is not important to read the whole chapter, but it can be helpful to read portions, especially those that pertain to the limiting factors identified for a project. Each limiting factor section discusses how to assess or record the factor and how to mitigate for it. Many of the mitigating measures discussed in this section are presented in further detail in Chapter 5. The mitigating measures described in this report are not a complete list and other practices should be considered based on local or regional experience. Section 3.12 discusses how to select the appropriate site improvement measures from the mitigating measures list.
Water input
|
Water storage and accessibility
|
Water loss
|
Nutrient cycling
|
Surface stability
|
Slope stability
|
Figure 3-11 | Factors that can limit plant growth
3.8.1 Water Input
Water input refers to the moisture supplied to the soil through rainfall, snowmelt, and road drainage. This moisture recharges the soil and becomes the primary source of water for plant establishment and growth. Water input is influenced by obstacles that capture, or intercept, water before it can enter the soil, including standing live or dead vegetation and soil cover (litter, duff, and mulch). Surface infiltration rates also regulate entry of surface water. If infiltration rates are low, water that would normally enter the soil runs off the surface and is unavailable.
The primary site factors that affect water input are as follows:
- Precipitation
- Rainfall interception
- Infiltration
- Road drainage
In the western United States, water input is at its lowest levels from late spring through early fall. This is also the period when plants require the most soil moisture for survival and growth. During the summer, when water input is low, the soil profile dries out as vegetation withdraws moisture. As soil moisture is depleted, plants cease growing; if soil moisture is not recharged, plants will go into dormancy or die. It is critical that any water from precipitation arriving during the dry season enters the soil and is stored for later plant use.
Precipitation
In wildlands revegetation, the only source of soil water comes through precipitation in the form of rainfall or snowmelt. In the western United States, this typically occurs from late fall through mid-spring, a period when plants are dormant and least able to utilize soil moisture for growth. Water that is not stored in the soil during these events is lost from the site either to ground water or runoff. The period when plants need soil moisture the most occurs during a five- to six-month period, from April through October. For most sites in the western United States, the amount of moisture that occurs in this period is less than a quarter of the total annual rainfall. Precipitation is also extremely low during the middle of the summer (Figure 3-12).
Plant survival and growth hinge on the precipitation that occurs in the years following planting or seeding. Very low precipitation in summer is common in the western United States (those areas west of the 1-inch line) but less common in the eastern United States, as shown in this map of the U.S. which depicts normal precipitation over a 30-year period for the month of August. Much of California, Oregon, Nevada, Idaho, and Washington receive less than one-half inch of rainfall in August as compared to many areas in the mid-western and eastern United States that receive more than 4 inches of rainfall in the same month. This pattern is typical of other months during the growing season (map generated from PRISM).
xxx Figure 3-12 goes here xxx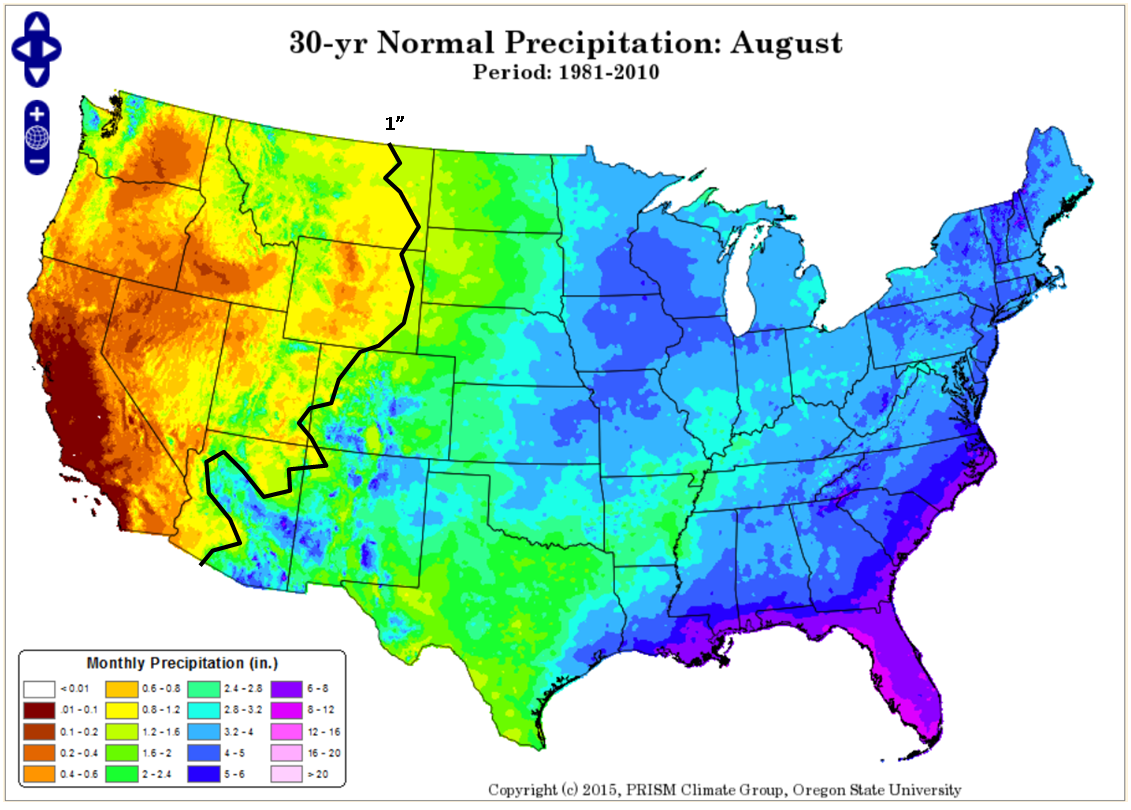
Figure 3-12 | 30-Year Normal Precipitation: August (1981-2010)
Plant survival and growth depend on the precipitation that occurs in the years following planting or seeding. Drought periods in the summer are common in the western United States (west of the 1-inch line) but less common in the eastern United States, as shown in this map of the U.S. which depicts normal precipitation over a 30-year period for the month of August. Much of California, Oregon, Nevada, Idaho, and Washington receive less than one-half inch of rainfall in August as compared to many areas in the mid-western and eastern United States that receive more than 4 inches of rainfall in August.
@copy;2015 PRISM Climate Group, Oregon State University
Vegetation native to the western United States has evolved to compensate for the limited supply of moisture during the growing season (Figure 3-13). During spring, when soils are charged with moisture from winter precipitation and soil temperatures increase, plants produce new roots, followed by new foliage. As the soil dries out and plants undergo mild moisture stresses, new root and foliage growth cease. During summer, soil continues to dry and plants respond to even greater moisture stress by shutting down their physiological functions and becoming dormant. By mid to late summer, when available soil moisture is depleted and evapotranspiration rates are high, plants will show stress symptoms (browning, loss of needles and leaves); under extreme circumstances, plants will die. By late summer and early fall, rain returns and the soil slowly moistens again, reducing plant moisture stress and signaling plants to grow new roots.
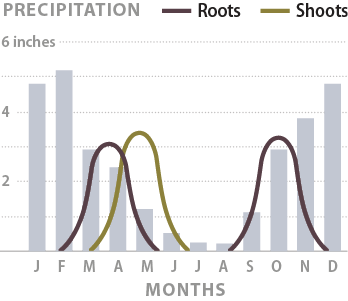
Figure 3-13 | Root and shoot growth
In the western United States, root and shoot growth occur when moisture is available in the spring. Growth ceases by early summer when there is very little rainfall. Root growth takes place again from late September through November when soils are recharged by fall rainstorms.
The primary characteristic of precipitation for plant survival is the quantity of rainfall delivered in each storm event during the dry season. Storm events that deliver more than one-quarter inch of rainfall can wet the surface portion of the soil profile and reduce plant moisture stress. Precipitation events that deliver less than this amount rarely supply enough water to enter the soil, especially if interception and runoff rates are high.
How to Assess Precipitation—Average monthly rainfall for a project area can be accessed through climate websites, as discussed in Section 3.3.1. For more site-specific information, precipitation can be collected on-site using rain gauges that capture and record precipitation.
Two types of precipitation gauges are available: digital and non-digital. The advantages of digital gauges are that they record the amount and intensity of rainfall at the time it occurred; the downside is cost (although prices are falling). Many types of digital rain gauges are available, ranging in price and quality. It is important to select a digital rain gauge that is rugged, self-maintaining, and can record for long periods of time. In addition, many remote stations have the capacity to transmit data via the web so it is easy to keep current on weather events.
Non-digital rain gauges are basically cylinders that collect and store precipitation while preventing evaporation. The gauges are monitored by simply measuring the water in the cylinder. The disadvantage of non-digital rain gauges is that they only report the rainfall that has occurred between site visits. They do not provide the dates when rainfall occurred and do not record rainfall intensities.
Mitigating for Low Precipitation—For projects where rainfall is limited during the growing season, making the most of rain and snowmelt that falls throughout the year is an important part of successful revegetation planning. In most cases, supplemental watering will not be feasible. However, if very little water input occurs during the summer, temporary supplemental water could be considered during plant establishment. This can take an active form, such as irrigation, or a passive form, such as redirecting surface water to planted seedlings.
Irrigation—Irrigation can be expensive, and it is generally used only on projects with high visibility or when rapid establishment is necessary for slope stability. These are projects where revegetation objectives include minimizing the risk of seedling failure or enhancing vegetation growth.
Several basic types of irrigation systems are used in roadside revegetation. They are grouped into fixed systems, such as overhead sprinkler and drip irrigation, and manually applied systems. Fixed systems are discussed in Section 5.5.5, see Drip Irrigation. Manual systems require water to be delivered directly to each plant, either from a hose or water container.
If only a few applications are necessary, the entire project can be irrigated by hand. Personnel can water each seedling or seeded area using a water truck or hydroseeding equipment (with water only), although care must be taken to avoid pulling hoses over establishing plants. Creating basins around seedlings will pond the surface-applied water and keep it concentrated in the seedling root zone. However, a better way to be certain that water will be delivered directly to the roots is to integrate the deep pot irrigation system into drip or manually applied irrigation methods (Bainbridge and others 2001). Pipes made from polyvinyl chloride (PVC) or other materials are placed at depths of 1 to 2 feet beside the seedling at the time of planting. The pipes are then filled with water when the soils dry out in summer. The advantage of deep pipe irrigation is that water is delivered directly to the root system and, because the water is placed deeper in the soil, roots are forced to extend farther into the soil for moisture. Refer to Section 5.5.5, see Deep Pot Irrigation, for how to install this system.
For any irrigation method, it is important to monitor the wetting pattern of each irrigation. This will ensure that water is applied at the appropriate rates. Digging a hole where the water has been applied at least several hours after irrigation will show how far the water has moved into the soil profile. Duration of irrigations can be adjusted accordingly.
Water Harvesting—Water harvesting is the alteration of local topography to capture runoff water and concentrate it in areas where it can be used by plants. Water harvesting designs can be applied to roadside revegetation in several ways. They include, but are not limited to, contour bench terraces, runoff strips, and fill slope microcatchments. Fill slope microcatchments take advantage of water that drains off road surfaces and shoulders during intense rainstorms by capturing runoff in berms or depressions created at the base of the road shoulder (Figure 3-14). Shrubs and trees planted in these catchment areas will receive greater soil moisture. Contour bench terraces are structures carved out of cut and fill slopes that collect and store runoff water. When filled with topsoil or amended soil, they are referred to as planting pockets. Figure 3-15 shows how planting pockets collect water. Even very low rainfall events, which would normally be of insufficient quantity to moisten the soil surface, can recharge soil in planting pockets and fill slope microcatchments. Sediments will also be deposited on the benches and pockets during rainstorms, building the soil up over time and reducing soil erosion. Water harvesting not only supplies additional water to plants but reduces sediment and peak flow water to the stream system. Road practices that intercept water and sediments from the road surface for water quality improvement are also a source of additional water for plant growth. These include amended slopes, filter strips, amended ditches, bio-retention swales, and constructed wetlands. In addition, some of these structures create surface-water sources for pollinator species.
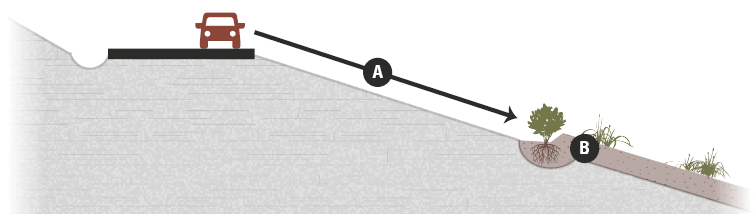
Figure 3-14 | Fill slope microcatchments
Fill slope microcatchments take advantage of the low infiltration rates of compacted fill slopes. Water moves off impervious road surfaces and compacted road shoulders during rainstorms (A), and is captured in berms or flattened areas below the road shoulder (B). If this area is ripped and amended with organic matter (e.g., filter strips, amended fill slopes), it becomes a very good environment for establishing shrubs and trees. Soil and compost berms and/or flattened areas are also catchments for sediments.
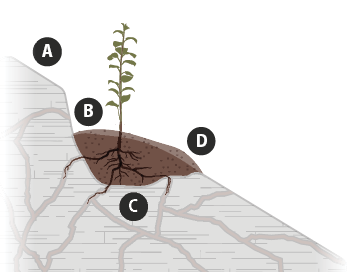
Figure 3-15 | Planting pockets
Planting pockets are designed to capture water from upslope runoff (A), which collects in a slight depression (B). Captured water wets the soil after each rainstorm and drains into the fractured bedrock (C). Soil is protected from surface erosion on the downhill side of the pocket with mulch or erosion fabric (D).
Rainfall Interception
The amount of water entering the soil profile from a rainfall event can be significantly reduced by the interception of live or dead vegetation cover. Rainfall is captured through a series of layers, beginning with the tree and shrub canopy, the ground cover, litter, and duff, and is returned to the atmosphere through evaporation. During the dry season, moisture from a low rainfall event might not reach the soil.
How to Assess Rainfall Interception—Rainfall interception can be determined by the soil cover and vegetation that exist on the site after construction. In most cases, there will be very little vegetation and ground cover. It is therefore important to understand the effects of various types of ground cover used in revegetation on the rainfall interception. The depth and water-holding capacity of the material will determine the effect on water input.
Water-holding capacity of a surface cover can be measured through testing labs specializing in composts. Alternatively, it can be measured by collecting the soil layer (duff, litter, mulch) and drying it at 230° F in a drying oven (a crockpot can be used, adjusting the temperatures using a meat thermometer). When the sample is dry, it is placed in a 5-inch-long by 3-inch-round PVC pipe with a flat piece of cardboard secured to the bottom of the tube to prevent the material from falling out. The PVC pipe is weighed and placed in a bucket that is filled with water to the top of the pipe. The sample is removed and allowed to drain.
After several hours, the pipe is reweighed. The material in the pipe is removed and the pipe plus cardboard is weighed. The moisture holding capacity of the material (by percentage of dry weight) is as follows:
(Wet weight of container and cardboard) - (Dry weight of container and cardboard)
(Dry weight of container and cardboard) * 100 * 100
Figure 3-16 can be used to approximate how much rainfall is intercepted based on the moisture-holding capacity of the soil cover.
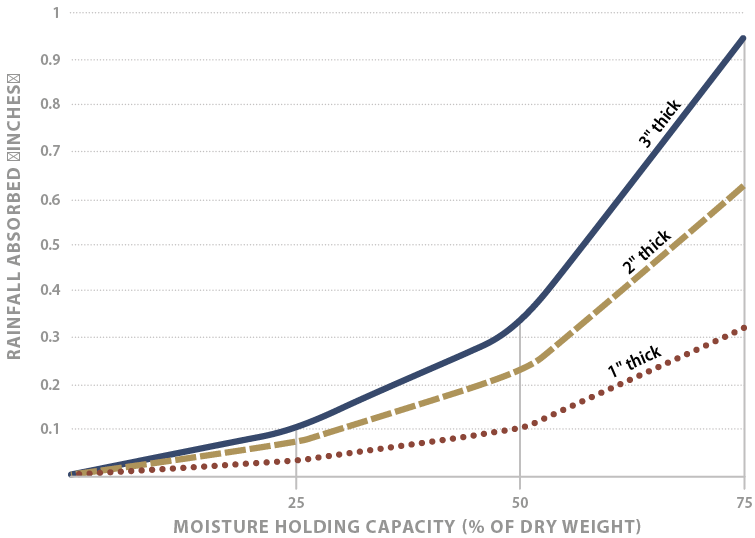
Figure 3-16 | Moisture holding capacity of mulch or litter
The amount of rainfall intercepted by soil cover (e.g., mulch or litter) is dependent on its water- holding capacity and thickness.
Mitigating for High Rainfall Interception—It is important to consider the water-holding capacities of the mulches or soil covers to be used, especially on arid sites. Highly decomposed, fine-textured composts have high water-holding capacities compared to coarser-textured composts and hold more moisture after a rainstorm. Coarser materials, such as shredded wood, bark, wood chips, and wood strands, hold less water, allowing more rainwater to enter the soil. In addition, because fine-textured composts hold more water than course mulches or soil, they are good growing media for desirable native plants as well as undesirable weed species. The question that should be asked when selecting a soil cover is whether it is to be used as a mulch or a growing media. If a mulch, then a coarse material should be used; if growing media, a fine compost should be used.
Infiltration
Infiltration is the ability of the soil surface to absorb water from rainfall, snowmelt, irrigation, or road drainage. When infiltration rates are slower than the amount of water applied to the surface of the soil, runoff will occur and this water will not be available for plant uptake. In addition, runoff can detach and transport soil, causing soil erosion, decreased water quality, and increased peak flows. Refer to Section 3.8.5, see Infiltration Rates for a discussion of infiltration rates on surface stability.
The size, abundance, and stability of soil aggregates in the surface soil determine the infiltration rates. Large stable pores created by worms, insects, and channels left behind from decayed roots will absorb water quickly and have high infiltration rates; soils that have been compacted, had their topsoil removed, or are low in organic matter will have poor infiltration rates.
Under undisturbed conditions, infiltration rates are typically high, especially where a litter and duff cover exists. When soil cover is removed, the impact from rain splash can seal the soil surface, creating a crust that will significantly reduce infiltration rates. Infiltration rates are also reduced when the soil is compacted by heavy equipment or traffic.
How to Assess Infiltration—The most accurate method to measure field infiltration rates the rainfall simulator (Section 3.8.5, see Infiltration Rates). This equipment is calibrated to simulate the appropriate drop size and impact velocity of many rainfall events (Grismer and Hogan 2004). The rainfall simulator is expensive to operate and is not routinely used by the designer. The most common application for this technology is in comparing different mitigating measures, such as mulches and tillage methods, on infiltration capacity.
Without conducting rainfall simulation tests, infiltration rates must be inferred by measuring soil strength using a soil penetrometer, bulk density measurements (Section 3.8.6, see Soil Strength), and from site characteristics such as visual observation of compaction and the percentage of soil cover. For most construction activities that remove surface cover or disturb the topsoil, it can be assumed that infiltration rates will be reduced to levels that will create overland flow under most rainfall intensities.
Mitigating for Low Infiltration Rates
Minimize Compaction—Driving heavy equipment over soils causes compaction and reduces infiltration rates. After sites have been prepared for seeding or planting, heavy equipment must not be driven over soils. Such practices that are often recommended for erosion control, such as trackwalking, can actually decrease infiltration rates and adversely affect the establishment and cover of native plants. These practices may not be appropriate on all soil types and should be assessed on a site-specific basis (Grismer and Hogan 2007).
Tillage—Infiltration rates can be increased through soil tillage, including subsoiling, ripping, and disking (Section 5.2.2). In most cases, tillage will reduce compaction and increase macro-pore space in the surface soil, as well as create surface roughness that further increases infiltration rates. Depending on the stability of the surface material and the level of organic matter, the effects of tillage on infiltration might only be effective for a short time. Under some conditions, tillage needs to be planned into the design of the road. Concentrated water from poorly designed road drainage or inadequate road maintenance has the potential to create deep gullies on tilled soils. Steep slopes in areas of high precipitation have a higher risk of slope failure if tilled slopes are not designed appropriately (Section 3.8.5, see Mitigating for Steep Slope Gradients). Deeper tillage and sculpting the subsoil are some methods to reduce these risks (Section 5.2.2).
Organic Amendments and Tillage—Incorporating organic amendments into the soil surface using a bucket of an excavator can create large, stable pores. However, unless the pores are interconnecting, they will not drain well (Claassen 2006). One method for creating continuous pores is to use long, slender organic material, such as shredded bark or wood, composted yard waste, straw, or hay (Section 5.2.5). Compared to short organic materials such as wood chips, longer materials can increase infiltration rates. Incorporating higher quantities of organic matter in the soil will also increase porosity because of the potential of the organic material to overlap and interconnect.
Mulch and Tillage—Applying mulch by itself does not necessarily increase infiltration rates, although it can reduce sediment yields (Hogan and Grismer 2007). However, combined with surface tillage in the form of subsoiling or ripping prior to application of mulch, infiltration rates can be significantly increased. Mulch fills in the micro-basins left from the tillage operation (Figure 3-17).
Figure 3-17 | Surface-applied compost
Surface-applied compost has greater surface area contact with the soil when it is applied to roughened surfaces (B), compared to smooth surfaces (A). Creating a rough surface prior to the application of compost creates better rooting, greater surface stability, and faster organic matter decomposition. Tilling the soil, through subsoiling and ripping, to depths of 1 to 2 feet (C) will break up compaction and create channels for compost to move into the soil, increasing soil contact and creating greater infiltration rates.
Establish Vegetation—Ultimately, the best method to increase infiltration is to create conditions for a healthy vegetative cover. Good vegetative cover will produce soils with extensive root channels, aggregated soil particles, and good litter layers.
Road Drainage
Depending on how the road is designed, surface road water from precipitation events is either dispersed or concentrated. Dispersed water is often seen on outslope or crowned roads, where water moves in sheets over the road surface during rainstorms and into the fill slopes. This water can be captured by water harvesting methods, as discussed in Section 3.8.1. Concentrated water occurs where runoff from the road surface and cut slopes, as well as intercepted water from seeps and streams, is collected in ditches that flow into culverts or other road drainage structures. When designed into the road drainage system, this water can be available for plant growth. Live silt fences, bio-retention swales, and constructed wetlands are some structures that take advantage of this additional water.
How to Assess Road Drainage—Road drainage is assessed by identifying drainage patterns on the road plans. Often the Storm Water Pollution Prevention Plans will show the detailed direction of surface road water. Culvert outlets are the areas most likely to have concentrated water that can be considered for use for plant establishment and standing water for pollinator habitat.
Mitigating for Road Drainage
Species Selection—In areas below culverts, soil moisture is typically higher than surrounding areas after rainstorms or snow melt. These areas may be suitable for more moisture-sensitive plant species that require increased soil moisture. When planted with plant species that support pollinators, these sites will increase pollinator habitat.
Large Wood—Obstacles, such as large wood, can be placed at the base of culverts or perpendicular to the slope to slow concentrated water and increase soil moisture in these areas. Large wood also provides nesting habitat or shelter for many pollinator species.
Biotechnical Slope Protection—Gullies can form below culvert outlets and, for this reason, these sites are often armored with rock. Moisture-loving vegetation, such as willows, sedges, and rushes, can be integrated into the hardened surfaces, such as live silt fences, as shown in Figure 3-18 and as discussed in Section 5.4.3.
Figure 3-18 | Live silt fence
In gullies, draws, intermittent streams, or below culvert outlets, live willow stakes are placed in rows, creating what is referred to as a live silt fence, to slow water velocities and catch sediment and debris (Polster 1997). The stakes root and establish into plants over time.
Water Harvesting—Road surfaces, shoulders, and to a lesser extent, cut and fill slopes are impermeable surfaces that create runoff water during precipitation. Utilizing this water for plant growth, as shown in Figure 3-14, is a form of water harvesting.
3.8.2 Available Water Storage and Accessibility
The previous section discussed how water enters the soil surface. This section describes how water is stored in the soil and how soil water is accessed by roots. Where precipitation is low or infrequent during the growing season, the amount of water a soil can hold between rainstorms is important from a plant survival and growth standpoint.
The total available water-holding capacity (TAWHC) is the sum of all water stored in the soil profile that is available to plant roots. The amount of water that a soil can store is primarily a function of the following:
- Soil texture
- Rock fragments
- Soil structure
- Rooting depth
- Mycorrhizal fungi
The amount of water a soil stores and how easily it is accessible by roots determines the types of species and the amount of vegetative cover a site can support.
Soil Texture
Soils are composed of minerals of varying sizes, ranging from clays (the smallest) to sands (the largest). Each mineral particle in a soil sample can be grouped into one of three categories depending on its size:
- Clay— <0.00008 in (0.002 mm)
- Silt— 0.00008-0.002 in (0.002 to .05 mm)
- Sand— 0.002-0.08 in (0.05 to 2.0 mm)
The proportion of these size groups in a soil is called the soil texture.
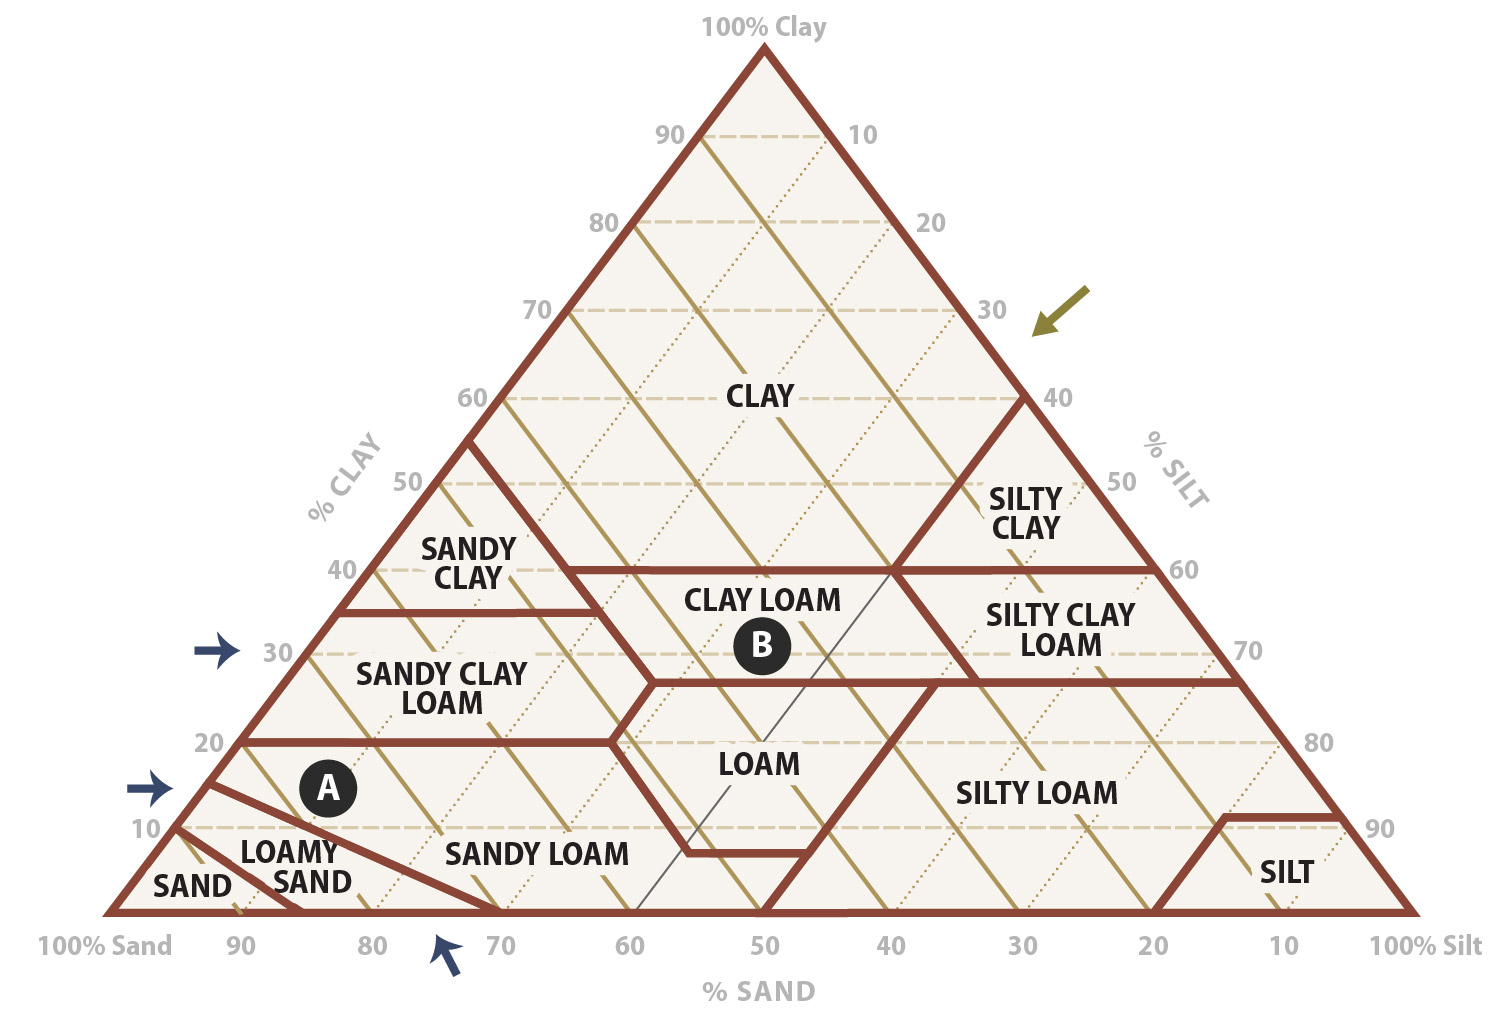
Figure 3-19 shows 12 soil textural classes by their proportions of sand, silt, and clay as defined by the U.S. Department of Agriculture classification system (Soil Survey Staff 1975). Two other soil classification systems, the American Association of State Highway and Transportation Officials (AASHTO) and the Unified Soil Classification systems, are used for geotechnical engineering. These two systems use different particle size ranges and include parameters such as liquid limit and plasticity in classifying soils. There is no accurate way of converting values from these systems to the USDA textural classes.
Figure 3-19 | Soil textural triangle
The soil textural triangle defines 12 textural classes based on the percentage of sand, silt, and clay in a soil sample. The textural classes make it easy to describe soils without having to state percentage of sand, silt, and clay. To use the textural triangle, locate the percentage of sand on the bottom side of the triangle and trace the line up to the left-hand side of the triangle. Do the same with either the silt or clay percentages on the other two sides of the triangle (follow silt diagonally down to the lower left and clay across from left to right). Where the two lines intersect is the textural class for that soil. For example, a soil with 75 percent sand and 15 percent clay would be a sandy loam (A). A soil with 30 percent clay and 35 percent silt would have a clay loam texture (B).
Soil texture is an important function of soil water storage because the unique arrangement of pores created in each texture class holds differing quantities of moisture. Clays are typically thin, wafer-like particles with highly charged surface areas that retain large amounts of water. Clay particles are often arranged to form small void spaces, or micropores, that also store water. Sands, on the other hand, are large, rounded particles that have a very low surface area and therefore do not hold as much water. The large pores (macropores) that are created when sand particles are adjacent to each other are good for air and water flow but poor for storing water. Soils high in silts hold more water than sands because of the greater quantity of micropores. However, silt particles are not charged, therefore holding less water than clays.
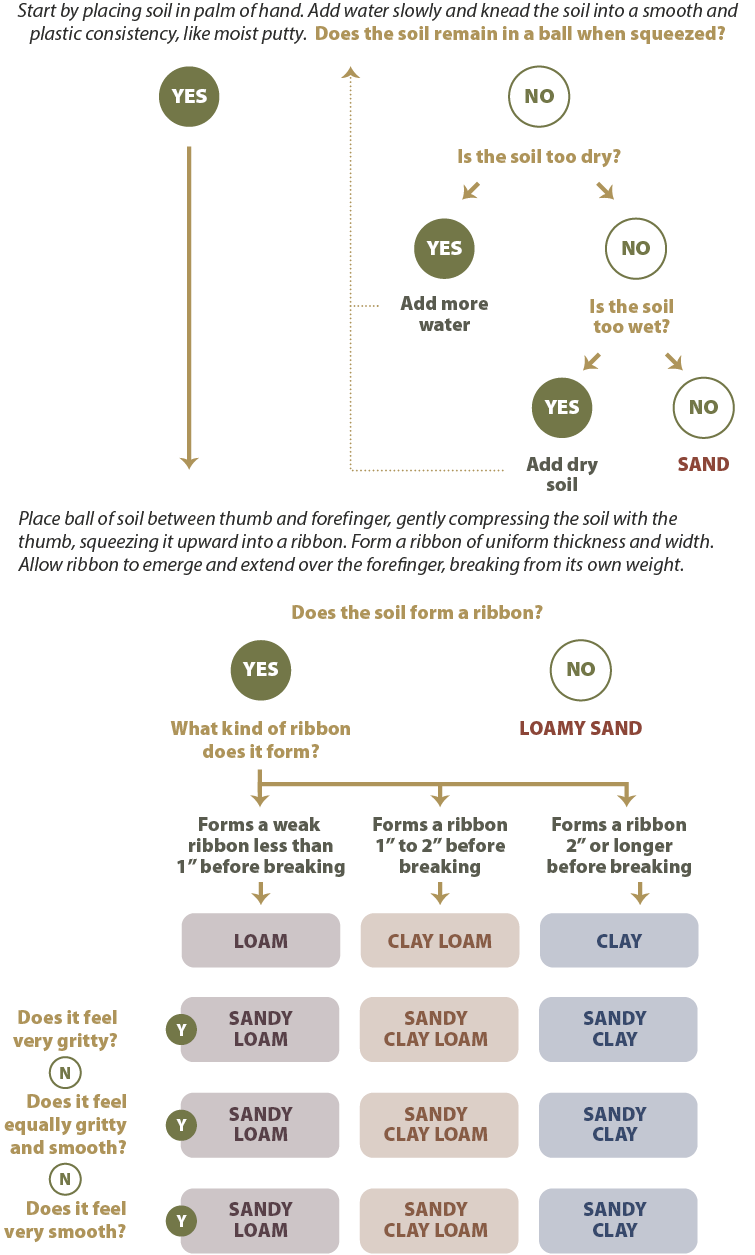
How to Assess Soil Texture—Soil texture can be determined fairly accurately in the field using the "feel" test. This is done with the aid of a soil sieve (2 mm opening size) and a bottle of water. Obtain a fairly dry field sample and separate the fine fraction from the coarse fragments with the sieve (note the volume of gravel in the sample). Take a sample of the fine fraction in the palm of the hand and moisten it with water. The soil is rubbed between the fingers and thumb and classified using the decision tree in Figure 3-20.
Figure 3-20 | Soil texture by feel method
With some practice, soil textures can be determined using the following guide.
Adapted from Colorado State University Extension Publication — #7.723
For a more exact determination of soil texture, a sample of soil can be sent to a soils laboratory for a particle size distribution test. This test will report the percentage of sands, silts, and clays in the sample. A Web Soil Survey report (Section 3.3.2) generated for the project area will also provide a good estimate of the soil textures.
Knowing soil texture is essential for estimating the available water-holding capacity (AWHC) of a soil. Figure 3-21 shows some typical available water-holding capacities for various soil textures. The values in this figure are generalized, but are acceptable for making recommendations on most revegetation projects. The Web Soil Survey and Soil Characterization Data websites (Section 3.3.2) may have available water-holding capacities for soils in the project area. For a more accurate assessment, samples can be sent to soils labs for moisture determination. This is a specialized test and not all labs offer this test; therefore, it is important to contact the lab prior to collecting samples. Water-holding capacity can also be measured using the methods outlined in Inset 3-1.
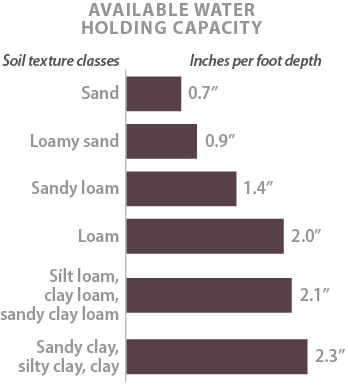
Figure 3-21 | Soil texture and available water-holding capacity
This chart shows the general relationship between soil texture and available water-holding capacity soils (adapted after Ley and others 1994). As clays increase in a soil, so does water-holding capacity. Typically, clay loam soils hold more than twice as much water as sandy textured soils. The presence of humus in topsoil increases water-holding capacity of loams and sandy loams at a rate of 2.25 percent water to each percent rise in soil humus (Jenny 1980), which equates to an approximately 0.75 percent increase in water holding capacity for every 1 percent increase in organic matter.
Inset 3-1 | Measuring available water-holding capacity
Modified after Wilde and others 1979
Available water-holding capacity (AWHC) can be measured in the field by collecting soil samples from a reference site or disturbed site in mid- to late summer when soils are presumably at their driest. Collect samples in bulk density rings in the same manner as sampling for bulk density (Section 3.8.6, see Soil Strength). After removing the ring from the soil, secure a piece of cardboard at each end of the ring to keep the soil from falling out, then place it an airtight plastic bag to ensure the sample stays intact during transport. When ready to take measurements, remove the top cardboard piece and weigh the sample. Place the sample in a bucket and fill with water to just the top of the ring. Allow the sample to saturate with water. Once the soil is fully saturated, remove the ring and allow it to drain. After 24 hours, remove the soil from the ring and weigh the soil (this is the wet weight), also weigh the ring and cardboard (allow the cardboard to dry first). To calculate the dry weight, subtract the weight of the dry cardboard and ring from the original dry sample weight.
Available water-holding capacity (inches of available water per foot) =
( wet weight - dry weight )
( volume of cylinder ) * 12
Mitigating for Textures with Low Water-Holding Capacities
Organic Amendments. Incorporation of organic amendments (e.g., compost, biochar, biosolids) can increase the water-holding capacity of a soil. Because the water-holding capacity of each type of organic matter varies by composition and degree of weathering, the effect on soil water-holding capacity by any organic matter being considered is assessed prior to application (see Section 5.2.5 for assessment methods). Sandy textured soils benefit most from organic matter additions, especially those with plant available water of 9 percent or less (Claassen 2006), which are typically sands, loamy sands, and sandy loam soils. Testing several different rates of incorporated organic matter on soil moisture-holding capacity prior to selection will help determine the appropriate amount of material to apply.
Clay—The water-holding capacity of sandy textured soils can be increased by incorporating soils with higher clay fractions into the sandy soils. These soils should have no more than 40 percent clay fraction (e.g., clay loam, sandy clay loam, and silty clay loam textures). The addition of clays should be at rates that result in new soil textures similar to loams, silt loams, or sandy clay loams. Higher rates of clay addition are not recommended. It is always important to test the additions of any soil to another to understand what the effects on water-holding capacity and structure might be. Ideally this should be done in the field in small plots.
Polyacrylamides—Polyacrylamides are hydrophilic polymers that absorb many times their weight in water. They are used to increase the water-holding capacity of greenhouse growing media. The value of using these materials in revegetation projects, however, is questionable based on the low plant response rates, high material costs, and difficulty of incorporating these materials evenly into the soil. A study, located at several semi-arid sites, showed that two rates of polyacrylamide crystals incorporated into road fills had no differences in native grass cover and survival and growth of outplanted pine seedlings from the controls (Riley and others 2013). Any full-scale use of polyacrylamides should be tested at different rates on the sites being revegetated. In addition, determining how polyacrylamide crystals would be evenly mixed into the soil is an important consideration when considering use of these materials.
Rock Fragments
Mountain soils and highly disturbed sites are typically high in rock fragments. The presence of rock fragments is important because rock reduces the amount of water and nutrients a soil can hold. At high volumes in the soil, rock fragments will limit the biomass and vegetative cover a site can support.
The rock classification system classifies rock fragments into the following five size ranges:
- Fine gravels—0.08 to 0.2 in (0.2 to 0.5 cm)
- Medium gravels—0.2 to 0.8 in (0.5 to 2.0 cm)
- Coarse gravels—0.8 to 3 in (2.0 to 7.0 cm)
- Cobble—3 to 10 in (7.0 to 20.0 cm)
- Stone—>10 in (20.0 cm)
Highly weathered rock can retain some soil moisture depending on the size of the rock fragments and degree of weathering (Flint 1983). For practical purposes, however, it is usually assumed that the presence of cobbles and stone rock fragments in the soil will reduce the available water-holding capacity of the soil proportionally. For example, a sandy loam soil without rock fragments has a water-holding capacity of 1.4 inches per foot of soil (Figure 3-21). When 30 percent large rock fragments are added to the soil profile, the available water-holding capacity is reduced to 70 percent, or 0.98 inches of available water ( 1.4 * 0.7 = 0.98 ). Alternatively, fine and medium gravels (0.08 to .8 inches in diameter) hold some moisture. A rule of thumb is that these fine and medium gravels reduce water-holding capacity by two-thirds of their volume. In the above example, if 30 percent of the soil were composed of medium and fine gravels, the available water in this soil would be 1.12 inches per foot ( 1.4 - ( 1.4 * 0.3 * 0.66 ) ).
How to Assess Rock Fragments—Rock fragment content is usually determined in the field. Large rock fragments, such as cobble and stones, are estimated in a variety of ways. The most common methods are surveying freshly exposed road cuts or observing soil excavation during road construction. Estimating the volume can be difficult, and often the amount of rock is over- or under-estimated. One method of estimating large rock in road cuts is to take a digital picture and lay a grid over the surface, as shown in Figure 3-22. Whenever rock is estimated from old road cuts, it must be discerned whether a portion of the rock is masked by soil that might have moved over the rock. A freshly exposed road cut provides the most accurate approximation of rock content.
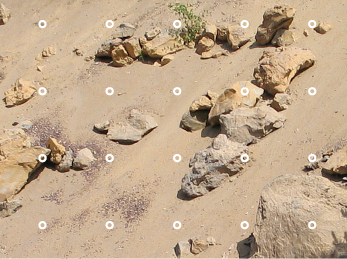
Figure 3-22 | Estimating rock fragment content from roadcuts
The amount of rock in a section of soil can be roughly estimated from road cuts. Large rock can be determined by laying a grid of 20 circles over a photograph of a road cut and recording the number of circles intercepting rock (in the center of the circle). This value is divided by the total number of circles in the grid to obtain the percentage of subsoil in rock fragments. In the picture below, subsoil contains approximately 25 percent large rock (5 intercepted rocks divided by 20 points).
Photo credit: David Steinfeld
Rock encountered while digging a soil pit will provide a more accurate estimate of larger coarse fragments. Cobbles and stones, if they can be moved, are set apart from the soil when the pit is excavated. The volume of cobbles and stones is then visually compared to the volume of soil excavated from the soil pit to estimate the percentage of rock fragments.
Gravel content is determined from the excavated soil by sieving it through several soil sieves. Sieves are available through most engineering equipment companies (Figure 3-23). The 2-mm sieve (also referred to as a #10 sieve) is the most important sieve to use because it separates the gravels from the soil fraction. Another useful sieve is the ¾-inch sieve because it separates the fine and medium gravels from the coarse gravels. This sieve can be used in the field to remove larger rock fragments from the soil sample to reduce the weight of the sample. When soils are dry, they are easier to sieve in the field; however, when they are moist, they must be air dried first before they can be sieved. The gravel and soil volumes are visually estimated.
It is important to include the volume of cobbles and stones estimated in the field with the gravels estimated through sieving to calculate the total rock fragments in a soil:
% rock fragments in profile = (100 - % cobbles and stone) * % gravels in sample
For example, a soil is estimated to have 25 percent cobbles and stones from observing road cuts and from several soil pits. Sieving shows that 50 percent of the sieved soil is composed of gravels. The soil would be composed of 25 percent cobbles and stones, 37.5 percent gravels ( ( 100 - 25 ) * 0.50 ), and 37 percent soil.
Figure 3-23 | Soil sieves for estimating rock content
The number 10 sieve (2 mm opening) on the right separates soil particles (C) from rock particles (B and A). The 3/4-inch sieve on the left separates the fine and medium gravels (B) from the coarse gravels (A).
Photo credit: David Steinfeld
Mitigating for High Rock Content
Rock Removal—Screening rock fragments from the soil will increase the available water- holding capacity of a soil. The greatest benefit from screening is with soils that are very high in cobble and stone, where the reduction in volume of rock in the soil would be significant. One type of screen is the "grizzly feeder" which acts as a giant sieve to sort out rock of any size depending on the screen opening widths. Screened soils have the greatest benefit where soils are shallow or a good ground cover is required (e.g., grasses and forbs).
Incorporate Compost—Compost incorporated in the soil at high rates will increase the water-holding capacity of a rocky soil. Depending on the size of the coarse fragments, incorporation can be difficult.
Surface Apply Compost—A more practical method to mitigate for rocky soils is to apply composts to the soil surface without mixing. When surface applied, composts can be good growing media for seeds of grasses and forbs (Section 5.2.3). At rates greater than 3 inches applied to the surface, seeds germinate well and establish into seedlings that can access moisture and nutrients not only from the compost, but also some moisture from the rocky soil below the compost. Be aware that on steep slopes, if the site is not prepared correctly, the layer between the compost and soil can become a slip plane on slopes when compost becomes saturated with water (Section 3.8.6, see Mitigating for Low Permeability).
Apply Topsoil—If topsoil is available, it can also be applied over a rocky soil (Section 5.2.4). Topsoil will have to be placed deep enough to compensate for the quantity of rock in the soil being covered. On steep slopes, preparation of the site prior to application of topsoil is important to avoid slope stability problems (Section 3.8.5, see Mitigating for Steep Slope Gradients).
Planting Islands—On very rocky sites, rocky soils can be mitigated by focusing mitigating measures into planting islands (Section 5.2.8). Where topsoil, compost, or screened soil is limited, this material can be concentrated in mounds, pockets, or benches strategically located throughout a revegetation.
Soil Structure
Just as soils are composed of many-sized mineral particles, they are also composed of different-sized voids (also referred to as pores) whose influence is responsible for water movement, water storage, air flow, and root penetration. Small pores (micropores) strongly influence the moisture-holding capacity of soils, while large pores (macropores) are responsible for water movement, air flow, and root penetration. Soil structure is the arrangement of soil particles into aggregated units that gives rise to the macro-porosity in the soil. It is qualitatively observed as cracks, channels, aggregates, crumbs, and clods in the soil, and described by alternative terms such as friability and tilth. Water flow and root penetration depend on good soil structure. If soil structure is poor or compacted, roots are less able to penetrate the soil to access water. Soil structure is important for other soil functions such as air flow, drainage, permeability, infiltration, and essential habitat for most soil organisms.
Soil structure is significantly reduced by operating heavy equipment over soils. The pressure applied by heavy equipment compacts the macropores, reducing soil volume and increasing soil density. This impact is called soil compaction Figure 3-24. The effects of soil compaction on tree growth are well documented (Poff 1996). Trees growing on highly compacted soils have far less root, stem, and leaf production than those growing on non-compacted sites. Studies have shown a linear relationship between the increase in surface soil bulk density and decrease in height growth of young Douglas-fir and ponderosa pine trees (Froehlich and McNabb 1984).
Figure 3-24 | Compacted soil
Compacted soils are created by heavy equipment operating over soil. The large pore spaces are compressed and the impacted soils often form a platy structure as shown in this photograph.
Photo credit: Tom Landis
It should be assumed that soils will be highly compacted after construction due to the use of heavy equipment. In addition to reducing the potential of a construction site to grow vegetation, compaction also increases runoff and sediment during rainstorm events, which can impact water quality. On sites where summer rainfall is limiting, there will also be less water entering the soil, reducing the amount of water available for plant growth.
Compaction can occur several feet below the soil surface, depending on soil texture, moisture, and the type and weight of equipment being operated. Very compacted soil layers can significantly reduce or eliminate root penetration. Where compacted layers occur, downward water movement is restricted and water may saturate the soil layers above the compacted layer. The resulting saturated soil conditions can be very restrictive to root growth because of the lack of oxygen and the propensity for higher incidence of disease (Steinfeld and Landis 1990) and seedling mortality (Figure 3-25). Compacted layers will naturally recover to their original porosity through root penetration, animal activity, and freeze-thaw events, but recovery can take 20 to 70 years (Wert and Thomas 1981; Froehlich and others 1983).
Figure 3-25 | Poor draining soils due to soil compaction
Compacted soils drain very slowly, as the puddles on the surface of the obliterated road in this photograph indicate. During rainfall or snowmelt, soils can stay saturated for days and even weeks. Establishing seedlings during this period can be very difficult because roots of most species cannot survive when soils are poorly drained. Seedlings shown in this photograph were dead within three months.
Photo credit: David Steinfeld
How to Assess Soil Structure—It is easy to qualitatively differentiate good soil structure from compacted soil, but measuring it quantitatively can be difficult. Indirect field tests to quantify soil structure include bulk density and penetrometer tests.
The bulk density test measures the dry weight of a standard volume of soil. If the soil has a high porosity, the bulk density values will be low; if the soil is compacted, the bulk density will be high. In this method, a cylindrical tube is driven into the soil with a portable bulk density sampler and a soil core is removed (Figure 3-26). The soil is shaved evenly on both ends so that the soil is exactly the shape and volume of the cylinder. The soil is then removed from the cylinder, oven-dried, and weighed.
Bulk Density = Weight of dry soil (g) / Cylinder volume (cc)
Bulk density values of a disturbed site must be related back to the bulk density of an adjacent reference site to make the values meaningful. Remaining within a 15 percent increase in bulk density over reference site values is ideal. Unfortunately, the bulk density method is time consuming and cannot be conducted on soils with high rock fragments.
Figure 3-26 | A soil core is used to assess soil compaction
Soil compaction can be assessed by measuring bulk density of a soil. The most common method is to drive a cylindrical tube into the soil, as shown in the photograph, and weighing the soil after it has been dried.
Photo credit: David Steinfeld
A less quantitative, but more practical, method of measuring soil porosity is with a soil penetrometer. This equipment measures soil strength instead of density. Compacted soils have greater strength, and greater resistance to penetration by a penetrometer, than non- compacted soils. Several types of penetrometers can be purchased for field work—penetrometers that measure the resistance as a continuous pressure is applied to the probe and penetrometers (impact penetrometers) that measure the number of blows of a hammer to drive the penetrometer into a specified depth. A monitoring procedure for assessing compaction using an impact penetrometer has been developed by the NRCS (Herrick and others 2005b). The most practical and economical field method for assessing compaction, however, is simply using a long shovel, as shown in Figure 3-27. In this method, a site is traversed and, at predetermined intervals, a shovel is pushed into the ground to determine how loose the soil is. By applying the entire body weight to the shovel and observing the distance the shovel penetrates the soil, a qualitative measurement of soil compaction can be made. A rule of thumb is that a shovel penetrating over 12 inches deep indicates a soil with a very high porosity; penetration below 3 inches deep indicates a very low porosity.
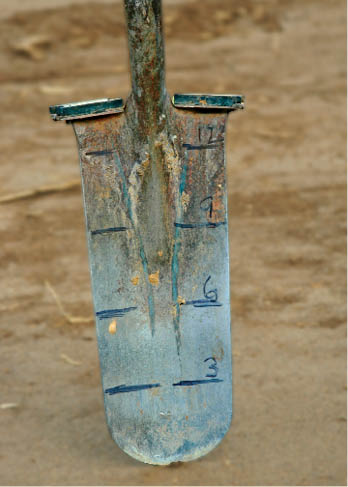
Figure 3-27 | A shovel can be used to determine depth to compaction
A simple, qualitative method of determining compacted layers is to mark the face of a long shovel with a ruler. Pushing the shovel in the ground with the entire body weight and observing the distance the shovel penetrates can indicate the depth to a compacted layer.
Photo credit: David Steinfeld
Whether a shovel is used or a soil penetrometer, the readings are affected by rock content and soil moisture. When soils are dry, they have greater strength and higher resistance to penetration. This is why any comparative sampling (e.g., comparing reference site to construction site soils) using a penetrometer must be done at the same moisture levels. Encountering large rocks can be confused with hitting a compacted layer. When this occurs, sampling should be done at several adjacent points until the penetrometer can be pushed into the soil without hitting rock. On very rocky soils, the penetrometer is not a practical tool.
Mitigating for Poor Soil Structure
Tillage—Breaking up compacted layers can be done effectively when deep tillage equipment is operated correctly (Section 5.2.2).
Incorporate Organic Matter—The effectiveness of deep tillage can be enhanced if organic matter is incorporated into the soil prior to tillage (Section 5.2.5). Organic matter can keep the soil from settling back to higher, pre-tillage densities. Application rates at which organic matter showed positive effects on soil structure was observed at a ratio of 25 percent incorporated organic matter to 75 percent soil by volume (Claassen 2006). Longer shreds of organic matter are preferred over smaller, chip sizes because the longer strands create interconnecting pathways for water, air, and roots while increasing soil strength (Claassen 2006). The additions of non-composted organic matter, however, will tie-up nitrogen for a period of time. While this might be problematic in the short term, the importance of developing soil structure for long-term site recovery often overrides concerns about the lack of immediately available nitrogen.
Operate Heavy Equipment with Care—Soil compaction is greatest when soils are moist. To limit the amount of soil compaction, schedule equipment operation during times when soils are dry. Compaction can also be minimized by using smaller equipment (Amaranthus and Steinfeld 1997) or leaving slash or deep mulch on the soil surface (which provides cushion).
Avoid Last Minute Compaction—Soil compaction is unavoidable during construction, but compacting soils after mitigating treatments have been implemented, such as tillage, must be avoided. In many cases the benefits of mitigating treatments have been nullified by the lack of attention to heavy equipment operations after topsoil additions or tillage treatments have been made. For example, topsoil salvage and placement, as discussed repeatedly in this manual, benefit the site in many ways. But this expensive mitigating measure loses much of its value if the soils are compacted during or after soil placement. Once topsoil is deep-tilled, every effort should be made to avoid any further equipment operation on the site.
Encourage Mycorrhizae Establishment—Mycorrhizal fungi build soil structure through hyphae and water stable organic glues (e.g., glomalin). Section 3.8.2, see Mitigating for Lack of Mycorrhizal Fungi covers methods beneficial for establishing mycorrhizae.
Rooting Depth
Rooting depth is the distance from the surface of the soil to the lowest point that roots can penetrate. It encompasses any strata (e.g., topsoil, subsoil, and parent material) that can be accessed by plant roots. The deeper the rooting depth of a disturbed site, the greater the total available water storage and the higher the productivity of the site.
Rooting depth is affected by restrictive layers that block root penetration to lower strata (Section 3.8.5, see Mitigating for Steep Slope Gradients). For example, the rooting depth of a post-construction site is estimated at 6 feet deep. However, further investigation finds that there is a highly-compacted layer at 12 inches, which would limit most, if not all, root penetration below that point. The rooting depth under these conditions has been reduced to only 1 foot of soil instead of 6 feet. Restrictive layers also include soils with very high or very low pH, toxic materials, or a high-water table.
Rooting depths vary by plant species and age of the vegetation. Most mature tree species have deep root systems that access subsoil and parent material; roots of grasses and forbs are predominantly limited to surface soils. Annual grasses and forbs require less rooting depth than perennial grasses and forbs, with the roots of these species growing in the upper surfaces of the soil. The age of the vegetation also determines the abundance and location of roots. Newly established seedlings have shallow roots but, as the plants mature, root systems expand to access moisture deeper in the soil.
Rooting patterns and root morphology play a role in how plants access soil water. Some species have finer-textured root systems that access tightly held soil moisture; other species have aggressive root systems that can penetrate deeply into cracks between rock fragments. Grasses, for instance, have shallower root systems than trees and shrubs, but their small size and high density in the surface soil gives them an advantage in shallow soils.
How to Assess Rooting Depth—Rooting depth should be estimated from reference sites during planning and post-construction, but it is not always an easy parameter to measure. Observing road cuts is often the best means to determine rooting depth. Rock type (e.g., granite, sandstone, and schist), fracturing patterns, rock weathering, and the degree of rock fracturing will provide an indication of rooting depth. Observing the amount and type of roots in the fractures of existing road cuts will give a good idea of rooting depth.
Fracturing and weathering of rock can also be determined from geotechnical analysis. If the bedrock has been drilled, the drill log report can provide an indication of degree and depth of rock fracturing and weathering. One way that rock quality is assessed is through a classification called the Rock Quality Designation Index (RQD). This system rates the bedrock by how much fracturing is observed in the cores. It is calculated by measuring the pieces of rock in the core sample that are longer than 10 cm, summing the length of these pieces, and dividing by the total length of the core (Deere and Deere 1988). A small RQD means that the bedrock is highly fractured whereas a high RQD means the bedrock is massive. A RQD may be poor from an engineering standpoint because of the high fractures, but favorable from a revegetation standpoint because cracks will hold some moisture and allow root penetration. A RQD rated as "very poor," "poor," and even "fair" should be somewhat favorable to root penetration.
Rooting depth is also affected by the presence of a restrictive layer caused either naturally or by compaction. How to determine the presence of these layers is addressed in Section 3.8.2, see Rooting Depth and Section 3.8.5, see Mitigating for Steep Slope Gradients.
The literature contains many references to defining the depth of soil needed to support different plant communities. For example, 18 inches of soil has been shown to support simple grassland ecosystems, but more diverse native grassland communities are reported to require up to 4 feet or more (Munshower 1994). These figures can be misleading if they are not put in the context of site climate and soil type. In many respects, it is more useful to state the TAWHC of a site rather than the rooting depth. The TAWHC is the total amount of moisture that a soil can store for plant growth when fully charged with water.
Table 3-8 shows how the TAWHC is calculated. Using the same format and equations, a similar spreadsheet can be created by copying the equations into the "Results" column. In this example, there is 1 foot of topsoil and 2 feet of subsoil over a highly-fractured basalt. The topsoil has a loam texture and available water-holding capacity of 2.0 inches (estimated from Figure 3-21 or obtained from lab results) but, because of the rock fragments, it is reduced by approximately 0.4 inch. The subsoil has a high water-holding capacity because of high clay content, but the available water-holding capacity is reduced by half due to rock. Highly fractured basalt is encountered at a depth of 2 feet, and it is estimated from the road cut that approximately 30 percent is actually fractured. Within these weathered fractures is a gravelly clay loam textured material storing approximately 0.5 inch of water. The TAWHC for this site would be the sum of all sections of soil (approximately 3.2 inches).
TAWHC is useful for comparing water relationships between revegetation units and reference sites. For example, the TAWHC for a post-construction soil is 3.6 inches compared to an adjacent reference site, which is 6 inches. If the desired future condition of the post-construction soil is to be similar to the adjacent reference site, then the TAWHC of 3.6 inches must be increased upward toward 6 inches for the site to be capable of supporting the vegetative community occurring on the reference site. If this is not possible, then the DFC target needs to be changed to reflect the plant community that the soil can support.
Soil strata |
Data |
Soil characteristics |
Results |
Equations |
|
0 to 1' |
A |
2 |
AWHC of texture (inches / foot) |
2 |
From Figure 3-21 or lab results |
B |
20 |
Small Rock (%) |
0.264 |
= A * ( B / 100 ) * 0.66 |
|
C |
5 |
Large Rock (%) |
0.1 |
= A * ( C / 100 ) |
|
D |
1 |
Thickness (ft) |
1 |
Thickness of soil section |
|
E |
Available water by section |
1.6 |
= ( A - B - C ) * D |
||
1 to 2' |
F |
2.2 |
AWHC of texture (inches / foot) |
2.2 |
From Figure 3-21 or lab results |
G |
35 |
Small Rock (%) |
0.5082 |
= F * ( G / 100 ) * 0.66 |
|
H |
25 |
Large Rock (%) |
0.55 |
= F * ( H / 100 ) |
|
I |
1 |
Thickness (ft) |
1 |
Thickness of soil section |
|
J |
Available water by section |
1.1 |
= ( F - G - H ) * I ) |
||
2 to 5' |
K |
2.2 |
AWHC of texture (inches / foot) |
2.2 |
From Figure 3-21 or lab results |
L |
35 |
Small Rock (%) |
0.5082 |
= K * ( L / 100 ) * 0.66 |
|
M |
70 |
Large Rock (%) |
1.54 |
= K * ( M / 100 ) |
|
N |
3 |
Thickness (ft) |
3 |
Thickness of soil section |
|
O |
Available water by section |
0.5 |
= ( K - L - M ) * N |
||
Total available water |
3.2 |
= E + J + O |
|||
Table 3-8 | Calculating total available water-holding capacity
The total available water-holding capacity (TAWHC) is the total amount of moisture that a soil can store for plant growth when fully charged with water. TAWHC values for each revegetation unit are helpful for determining which species will perform well and in developing the mitigating measures necessary to increase water-holding capacity or rooting depth. TAWHC is calculated by determining the texture, rock fragment content, and depth of each soil layer, and calculating how much water each layer will optimally store. The water- holding capacity of each soil layer is added together to obtain the TAWHC for the soil profile.
Mitigating for Poor Rooting Depth
Increase Available Water-Holding Capacity—Improving the water-holding capacity of the existing soil will increase TAWHC. Mitigating measures discussed in Section 3.8.2 can be used to increase soil moisture.
Tillage—If restrictive layers due to compaction are encountered, deep tillage should be considered. Section 5.2.2 provides guidelines for deep tillage.
Apply Topsoil—Increasing rooting depth and TAWHC can be accomplished by applying topsoil (Section 5.2.4).
Planting Islands—Mitigating measures, such as applying topsoil, organic matter incorporation, deep tillage, and other measures that increase water-holding capacity, can be focused in strategic locations, such as planting islands. This will conserve materials and reduce costs (Section 5.2.8).
Blasting—Strategic blasting to shatter the parent material has been suggested as a possible means of increasing rooting depth (Claassen 2006).
Mycorrhizal Fungi
The discussion to this point has addressed the primary factors responsible for soil water storage (soil texture, rock, and rooting depth) and ease of a plant through its roots to reach this water (soil structure). In this section, the discussion turns to how plants increase the efficiency of accessing water through mycorrhizae. While mycorrhizae provide many other benefits to the site in addition to water enhancement, they are covered in depth in this section because of the importance of water to establishing vegetation on highly disturbed sites in the western United States.
Mycorrhiza is the unique symbiotic relationship between fungi (called mycorrhizal fungi) and host plants. To the naked eye, many mycorrhizal fungi appear as a fine web or netting that seems to connect the root system to the surrounding soil (Figure 3-28), and in essence, this is exactly what is occurring. The extremely small hyphae of the mycorrhizal fungi are actually taking on the form and function of an extended root. Because mycorrhizal hyphae are up to five times smaller, they are able to access spaces in the soil not easily accessible by larger plant roots. Mycorrhizal hyphae not only provide the plant with greater access to soil moisture and nutrients, they also surround and protect roots from soil pathogens. In return, the host plant supplies carbohydrates to keep the mycorrhizal fungi alive.
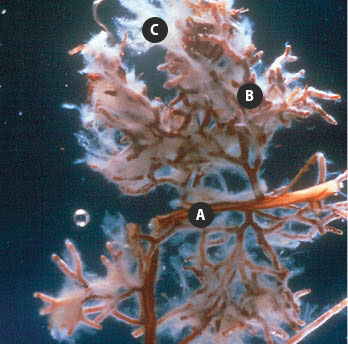
Figure 3-28 | Mycorrhizal fungi extend root systems
Mycorrhizal fungi can greatly increase the surface area of the root system. The ectomycorrhizal fungi attached to the pine root system (A) comprise most of the absorptive surface shown in this photograph. The mycorrhizae include brown branched structures (B) and white hyphae or filaments (C).
Photo credits: Mike Amaranthus, Mycorrhizal Applications Inc
Mycorrhizae play a critical role in site restoration by building soil structure. Hyphae and water stable organic "glues," such glomalin, are excreted by the mycorrhizal fungi and bind soil particles together into aggregates. These aggregates stabilize the soil (Section 3.8.6, see Soil Strength) and are important for good air exchange and water permeability. This basic soil building process, or repair, facilitates the creation of nutrient reserves and nutrient cycling essential for restoring ecosystems (Miller and Jastrow 1992). Mycorrhizal fungi can also improve survival of tree and grass seedlings (Steinfeld and others 2003; Amaranthus and Steinfeld 2005). A healthy population of mycorrhizal fungi has also been shown to increase plant biomass and cover (Wilson and others 1991; Brejda and others 1993; Sobek and others 2000), and increase the diversity of native species (Smith and others 1998; Charvat and others 2000).
Ninety percent of all terrestrial plants form symbiotic relationships with mycorrhizal fungi. Of the thousands of known species, most generally fall into two categories—ectomycorrhizal fungi and arbuscular mycorrhiza fungi.
Arbuscular mycorrhizal fungi (AMF), formerly called endomycorrhizae, are the most commonly occurring mycorrhizal fungi, forming on 75 to 85 percent of plant species. These include legumes, composites, grasses, bulbs, most shrubs, and ferns. In addition, AMF occur on many tree species, including redwoods and some cedars, and many types of tropical trees. AMF grow inside the roots of the host plant and extend hyphae out into the soil. These fungi are more general in their association with plant species, meaning that one mycorrhizal species can form an association with a broad spectrum of plant species. AMF reproduce in two ways: by forming single spores outside of the root and from fungal structures (vesicles and hyphae) present inside a colonized root system. Arbuscular mycorrhizal fungi do not disperse their spores in the wind, but instead are dispersed from root to root or by animals. For this reason, recolonization of drastically disturbed sites by arbuscular mycorrhizal fungi can be slow, especially if there are limited sources of healthy, undisturbed soils nearby to repopulate the site.
Unlike arbuscular mycorrhiza fungi, ectomycorrhizal fungi, as the name implies, coat the outside of the roots with hyphae that extend out into the soil. Ectomycorrhizal fungi form on 5 to 10 percent of plant species, the majority of which are forest trees in the western United States. Species include Douglas-fir, western larch, true firs, spruce, hemlock, oak, manzanita, willows, and cottonwood. These fungi form a netting of fine hyphae around the root system that is often observable on nursery produced seedlings inoculated with mycorrhizal spores. Unlike AMF, the relationship between ectomycorrhizal fungi and host species is very specific. Many ectomycorrhizal fungi species have evolved to associate with only one plant species. Ectomycorrhizal fungi produce fruiting bodies, such as mushrooms, puffballs, and truffles, which yield reproductive spores for wind or animal dispersal.
AMF and ectomycorrhizae do not associate with all plant species. For instance, in the western United States, arbutoid mycorrhizae forms on manzanita and madrone, while huckleberry form ericoid mycorrhizae. Still another 10 to 15 percent of the plant species in the United States do not form mycorrhizae at all. Many of these plant species have evolved root systems that function similarly to mycorrhizae and therefore give them an advantage over many mycorrhizal plant species, especially during early plant establishment when mycorrhizae inoculum may be limiting. This advantage is why many plant species, considered highly aggressive weeds, are non-mycorrhizal species.
How to Assess Mycorrhizal Fungi—Where soils have been drastically disturbed, it can be assumed that the mycorrhizal fungal propagules are drastically reduced or absent from the site. The size and severity of the disturbance determine the diversity and quantity of mycorrhizal fungi. As the level of disturbance increases, the density of viable fungi propagules typically decreases. Small disturbances surrounded by native forests or rangelands often reestablish quickly; in larger disturbances, where topsoil has been removed, recolonization by mycorrhizal fungi may take years.
Some laboratories offer testing for mycorrhiza fungi, but these are expensive tests. Because it is unlikely that mycorrhizal fungi will be found in recently disturbed sites lacking topsoil, conducting these tests for most projects is unnecessary.
Mitigating for Lack of Mycorrhizal Fungi
For most construction projects, the management of mycorrhizae should be considered in the early stages of project planning. Several strategies are available to enhance mycorrhizal colonization.
Minimize Soil Disturbance—Operations that maintain topsoil will often preserve mycorrhizal inoculum and maintain soil nutrition. Partially disturbed topsoil is often adequate for reestablishing mycorrhizal plant species. Partial disturbances include clearing and grubbing of road right-of-way vegetation, ground-based logging, and light to moderate intensity burns. Colonized root systems left behind in these operations are sources of inoculum for endomycorrhizae.
Leave Undisturbed Areas—The movement of AMF into highly disturbed sites is slow. Spores are transported by soil erosion and animal movement but not by air. Leaving small areas of native vegetation and undisturbed soils within the larger disturbance reduces the travel distance of AMF, facilitating a quicker repopulation of the disturbed site. This practice is especially important where the size of the disturbance is large.
Salvage Topsoil—Salvaging topsoil and reapplying it to drastically disturbed sites is commonly done when quality native topsoil is available (Section 5.2.4). Topsoil obtained from non-forested sites, such as meadows, rangelands, and unforested clear-cuts, is typically high in AMF which is important for grass and forb establishment. Salvaged topsoil forested sites will have mycorrhizae suitable for tree species as well as grass and forbs.
Apply Topsoil to Planting Holes—If topsoil is very limiting, placing healthy topsoil into holes prior to planting seedlings is an effective method of introducing an inoculum to a disturbed site. Collecting soils as inoculum from young, actively growing forests has been shown to be suitable inoculum for young tree seedlings (Amaranthus and Perry 1987).
Apply Commercially Available Mycorrhizal Fungi Inoculums—Applying commercially available mycorrhizal fungi inoculum is another method used to repopulate highly disturbed sites (Section 5.2.7). Commercially available sources of mycorrhizal inoculums are available for ectomycorrhizal and AMF plant species. These inoculums can be applied in hydroseeding slurries, as seed coats and root dips, through irrigation systems, or incorporated into the soil by broadcasting or banding. Fine grades of mycorrhizal inoculum are applied to the surface of the soil and will move into the soil surface with rainfall. Coarser-textured commercial inoculums must be incorporated in the soil to make them effective. When purchasing live plants from a nursery, rooting media can be inoculated with mycorrhizal fungi during nursery culture (Figure 3-29).
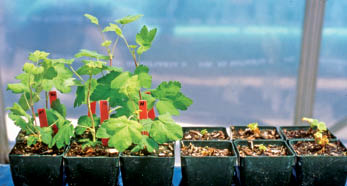
Figure 3-29 | Non-mycorrhizae inoculated seedlings versus inoculated seedlings
The response of adding mycorrhizae spores to non-inoculated seedlings (right) can sometimes be dramatic. Both sets of sticky currant (Ribes viscosissimum) seedlings shown in this photograph were stunted for months after seed germination. AMF spores were applied to the surface of each seedling container on the left with immediate growth response, while those on the right without mycorrhizae remained stressed (photo taken 50 days after inoculation).
Photo credit: David Steinfeld
Reduce Fertilizer Use—While the application of fertilizer can increase plant biomass in the short term, it can also suppress mycorrhizal infection (Jaspers and others 1979; Claassen and Zasoski 1994). However, at lower rates, fertilizers have been shown to help plant establishment and improve mycorrhizal colonization (Claassen and Zasoski 1994).
3.8.3 Water Loss
Water loss is the depletion of soil moisture through transpiration (loss of water through leaves/needles) and evaporation of soil moisture from the soil surface. The rate at which evaporation and transpiration draw moisture from the soil profile is the evapotranspiration (ET) rate. ET rates change daily (rates rise through the day with increasing temperatures and winds speeds and decrease at night), weekly (as weather systems move through), and seasonally (rising in spring and summer and decreasing in fall and winter) (Figure 3-30).
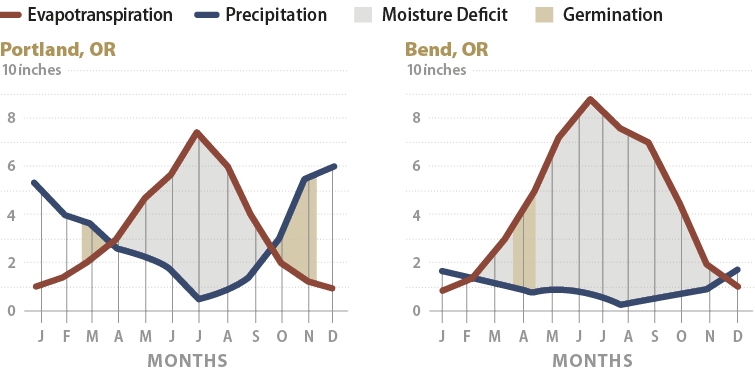
Figure 3-30 | Evapotranspiration rates
Evapotranspiration (ET) rates can be found for many NOAA weather stations. Plotting monthly evapotranspiration rates with precipitation rates (also found on the website) gives a good indication of the climate during plant establishment and growth phases. The graphs on the left show that the climate in Portland, OR, has a very favorable environment (low evapotranspiration and high precipitation) for seed germination in March; therefore, plant establishment should be adequate without the need for extra mitigating measures. The weather in the fall is also conducive to germination and plant establishment. The climate in Bend, OR, during April and May when seeds in that area germinate has very high ET rates and very low rainfall; mitigating measures such as applying mulch over the seeds at sowing might be critical for success.
The plant is a conduit for water transport between the atmosphere, which demands water from the plant, and the soil, which acts as a bank of water. When ET rates are low, plants can easily pull water from the soil through the leaves to the atmosphere. As soil moisture is depleted through time, there is less moisture to draw from and plants come under greater stress. With rising temperatures, lower humidity, and lack of rainfall, plants will be under very high moisture stress levels (Figure 3-31). The amount of stress that a plant is under is referred to as plant moisture stress (PMS) (Figure 3-32). PMS is at its highest from middle through late summer in the western United States, when the ET rates are at their highest and soil moisture levels at their lowest.
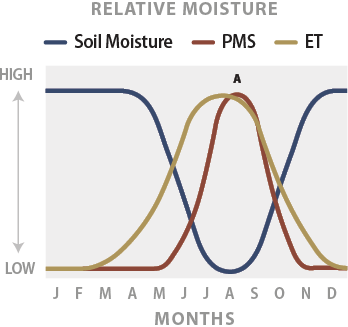
Figure 3-31 | Relationships among evapotranspiration, soil moisture, and plant moisture stress
Conceptual relationship between evapotranspiration (ET), soil moisture, and plant moisture stress (PMS). In the western United States, PMS lags behind ET in late spring because soil moisture is still moderate to high from the winter rains. By mid summer (A), plant moisture stress has increased to its greatest level in the year because soil moisture is at its lowest. Newly planted seedlings undergo extreme stress during this period. Unless the seedlings are dormant or their root systems have grown deeper into the soil, where there is greater access to soil moisture, seedlings will die. In late summer and early fall, cooler weather returns and rains wet the soil, driving ET and PMS rates down again.
Figure 3-32 | Plant moisture stress
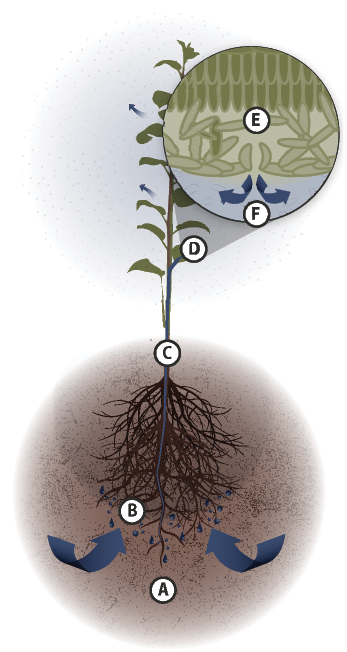
Plant moisture stress (PMS) is a measure of the tension or pull of moisture through a vascular plant. Much like a straw, when the demand for moisture at the surface of leaves is high, moisture is drawn from the stomata. This creates a pull of water through the leaves, stem, and down to the roots, which draws water from the soil.
Location |
Water |
|
A |
Soil |
-0.1 |
B |
Plant roots |
-0.3 |
C |
Plant stem |
-0.6 |
D |
Plant leaf |
-0.9 |
E |
Plant stomata |
-25.0 |
F |
Atmosphere |
-125.0 |
Water loss due to ET can be influenced by a number of abiotic and biotic factors, primarily:
- Wind
- Site aspect
- Competing vegetation
- Humidity
- Soil cover
Wind
Wind is often overlooked as a factor in the success or failure of establishing native vegetation, but it can play a major role, especially on sites where summers are hot and dry and soil moisture levels are low. Until seedlings become established, wind can place extremely high demands for moisture on newly planted seedlings, severely limit growth, and ultimately lead to death. Wind can also be an important factor for surface stability, as discussed in Section 3.8.5.
How to Assess Wind—Wind speed equipment is available but is most likely too costly for most designers. Site visits during different times of the year, especially in the summer, can give some indication whether wind is a problem. Visiting the site during the afternoon is important because this is the time of day when hot, dry winds negatively affect plants the greatest. Other site characteristics, such as position on the slope (e.g., ridgelines are more prone than valley floor), or proximity to forested environments—as forests often reduce wind speeds—can be used to infer wind strengths and directions.
Mitigating for High Wind
Road Design—Designing islands of undisturbed vegetation to help break up wind patterns can aid vegetation establishment. The taller the plants left undisturbed, the greater the wind protection. Established trees, particularly those with low-growing branches, provide the greatest protection from wind.
Wind Barriers—Obstacles that block wind at the soil surface can be effective for early seedling survival. These obstacles can include trees and tall shrubs, shelterbelts, filter fabric, stabilized logs, large rocks, berms, and stumps. In using these structures, seedlings should be planted on the windward side.
Tree Shelters—Tree shelters completely surround seedlings and block them from the wind (Section 5.5.4). They are an effective means of reducing ET rates created by high winds during early establishment. Once the vegetation has emerged from the top of the tube, however, tree shelters no longer protect the emerging foliage from the wind.
Shade Cards—Shade cards are sometimes used to block wind, but they are less effective than the fully enclosed tree shelter (Section 5.5.3). When used to block wind, shade cards must be placed on the windward side of the seedling, which is not necessarily the same location that cards would be placed if protection from sun is the objective. Often two shade cards are placed around the seedling for added protection against the wind. Placement of the shade cards at the height of the foliage affords greater protection to the seedling.
Appropriate Species Selection—The drying and damaging effects of wind are important considerations in appropriate species selection. A simple assessment of soil type and rainfall may not account for the effects of wind. Choosing hardier, wind-tolerant, and more drought-tolerant species may be necessary to establish vegetation on windswept sites. Find reference sites in windy locations to indicate which species are adapted to wind.
Leave Surface Roughened—A roughened soil surface can create a micro-basin or relief that protects young germinants from the drying effects of wind during the establishment phase (Section 5.2.2).
Aspect
Aspect is the direction a slope is facing and is one of the predominant site characteristics affecting evapotranspiration. South and west aspects receive more solar radiation during the day and are warmer and drier, with higher ETs than north and east aspects. Soils on these south and west aspects dry out faster than north and east slopes. In spring, during seed germination, south and west aspects can dry very quickly between rainstorms, reducing the rates of germinating seeds. As seedlings emerge and grow through spring and early summer, temperatures on the south and west slopes continue to rise to very high levels, creating very unfavorable conditions for seedling establishment. Even with planted seedlings, high surface temperatures can damage stems near the ground line, severely affecting seedling survival and establishment (Helgerson and others 1992).
In climates where moisture is not the limiting factor, south and west slopes are often very productive and have greater cover. Warmer soil and air temperatures create a longer growing season, offsetting the effects of moisture stress on plant growth.
On high elevation sites, north and east aspects are cool, with much shorter growing seasons, compared to the south and west aspects, resulting in very different compositions of species. At high elevations, soils on south and west slopes stay warmer longer in the fall, providing an opportunity to plant in the late summer in time for seedlings to become established before winter arrives. During spring, at all elevations, south and west slopes warm up much sooner than north slopes, resulting in earlier seed germination and plant growth. The difference in soil temperatures between north and south aspects is a consideration for determining when to plant and what species to use.
How to Assess Aspect—Aspect is measured in the field by facing the fall line of the slope (the imaginary line a ball would roll) and taking a compass bearing downslope. A "northeast slope," "northeast aspect," "northeast exposure," or "northeast-facing slope" all refer to an aspect with a compass bearing facing northeast.
Aspect can also be measured from topographic maps by drawing an arrow perpendicular to the contour lines and pointing the tip of the arrow downslope. Aspect is often a factor for delineating one revegetation unit from another due to the strong influence it has on the growth and survival of seeds, seedlings, and cuttings.
Soil and air temperatures differ greatly between aspects, and taking temperature measurements can be important for assessing the effects of aspect on revegetation. There are many types of recording devices available on the market, but only equipment that can download data to spreadsheets for analysis and graphing should be considered. Some equipment has become so inexpensive that more than one unit can be purchased (Figure 3-33).

Figure 3-33 | Temperature recording device
Temperature recording technology has become smaller and very inexpensive. The iButton® shown next to the nickel can record more than a year of temperature data.
Photo credit: David Steinfeld
Mitigating for South and West Aspects
For most sites, any treatment that will shade vegetation on the south and west slopes from intense solar radiation should increase survival and growth of establishing plants.
Overstory Vegetation—Keeping overstory trees at a minimum density of one tree per tenth acre is a rule of thumb for reducing soil temperatures below lethal levels on south aspects (Helgerson and others 1992).
Shade Cards—Shade cards can significantly increase seedling survival on south aspects (Hobbs 1982; Flint and Childs 1984) (Section 5.5.3). They must be placed close to planted seedlings so that the stem and lower portion of the seedlings are shaded from the afternoon sun (Helgerson and others 1992).
Obstacles—Large obstacles that cast significant amounts of shade on young seedlings will create a more favorable environment for seedling establishment and increase seedling survival (Minore 1971). These include stabilized logs, large rocks, berms, and stumps. Seedlings should be planted on the north and east side of these features to be shaded from the afternoon sun.
Mulch—On south exposures, the use of mulches as a moisture barrier should be considered for seedlings, seeds, and cuttings (Section 5.2.3). Avoid placing mulch in direct contact with the stem of the seedling.
Species Mix—The composition of species will probably be different for north and south aspects. Species adapted to hotter and drier environments are used for revegetating south exposures; those adapted to cool, moist environments are used on north aspects. Elevation can offset the effects of aspect. For example, species that grow on low elevation, north aspects often occur several thousand feet higher on south aspects because of the difference in temperatures. Reference site vegetation surveys will guide in the selection of appropriate species for each exposure.
Plant Material Rates—South aspects often require a higher density of seedlings, cuttings, and seeds than north aspects to offset the expected higher mortality rates. Adjusting for increased mortality rates is made when calculating plant materials rate for seeds (Section 5.4.1), cuttings (Section 5.3.5), and plants (Section 5.3.6).
Planting and Sowing Windows—Take advantage of warmer spring and fall soil temperatures on the south exposures by sowing and planting earlier on these sites (Section 3.14.2).
Competing Vegetation
Controlling competing vegetation around planted seedlings, whether native or non-native, reduces the rate at which water is withdrawn from the root zone and increases the potential for survival and growth. The rate at which water is depleted is a function of the type and amount of competing species. Grass species, for example, have a very fibrous root system in the upper soil horizon that allows them to withdraw moisture very quickly and efficiently during dry weather. Unless grasses are controlled, especially in the western United States, it is very difficult to achieve good survival or growth of planted seedlings in areas with high densities of grass. Perennial forbs are generally less competitive than grasses because their root systems are deeper and less concentrated in the surface where the seedlings are withdrawing moisture.
Revegetating with a seed mix is also affected by the type and quantity of competing vegetation. Those species that germinate earlier than the seeded species in the spring or fall will deplete soil moisture before the seeded species can establish. Cheatgrass is an example of an annual species that establishes quickly when soil temperatures are cool during early spring, depleting the surface soil moisture just as perennial species are beginning to germinate. How to assess and mitigate for competing vegetation is discussed in detail in Section 3.11.
Soil Cover
The thickness and composition of material that covers the soil surface influence many important soil properties covered in this manual, such as infiltration rates, interception losses, soil temperatures, surface erosion, runoff, and soil moisture loss. The following discussion focuses on soil cover as it affects soil moisture loss through evaporation.
Under undisturbed conditions, soil cover is predominantly composed of duff, litter, and stems that block the escape of soil moisture through evaporation (Figure 3-34). Mulches are also unfavorable seedbeds for weed seeds because duff and litter dry out quickly. Disturbed soils, on the other hand, are mostly composed of bare soil. Evaporation from the surface of bare soil can be high, extending to at least 6 inches below the soil surface, affecting seed germination and seedling establishment rates. Until roots of planted or seeded seedlings have extended farther into the soil profile, surface drying will negatively affect seedling establishment, especially on sites where water input and storage are already limiting.
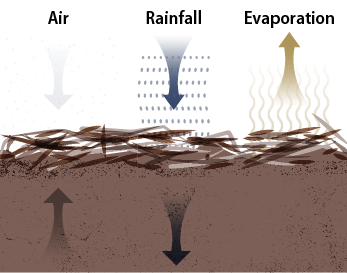
Figure 3-34 | Effective mulch cover
An effective mulch for seed cover is one that is stable and allows good airflow and rainfall entry, while reducing evaporation from the soil surface.
How to Assess Soil Cover—Soil cover can be measured on undisturbed and disturbed reference sites or post-construction sites through the ground cover monitoring procedures outlined in Section 6.3.1. In this procedure, the percentage of area in litter, duff, rock, vegetation, and bare soil is recorded and periodic measurements of litter and duff thickness are made.
Mitigating for Low Soil Cover
Mulches for Seedlings and Cuttings—Mulches create a more favorable environment for establishing seedlings and cuttings not only by reducing surface evaporation, but also by decreasing the amount of competing vegetation. There are three types of mulches for seedlings and cuttings—organic aggregate, sheet mulches, and rock mulches. The organic aggregates are thickly applied ground wood or bark, while the sheet mulches are made from non-permeable or slightly permeable plastic, newspaper, or geotextile. Rock mulches are composed of gravels, cobbles and stone. Mulches are placed around the base of the seedling and cover at least a radius of 1.5 feet from the base of the seedling (Section 5.2.3 for how to install).
Mulches for Sown Seeds—Selecting and applying mulches over sown seeds differ from those selected for planted seedlings and cuttings. Mulch application for seedlings and cuttings is typically too thick for seeds to germinate and grow through. An ideal seedbed mulch is one that is applied at the highest rates without affecting seedling emergence. Long-fibered mulches, such as straw, hay, shredded wood, or wood strands, create the greatest loft or thickness. At the optimum thickness, these mulches allow some light to penetrate and space for seedlings to emerge. Short-fibered mulches, such as wood fiber and paper found in hydromulch products, are more compact and create less loft. While these products reduce erosion rates, they are not necessarily good as seed covers (Section 5.4.1, see Determine Seedling Methods).
3.8.4 Nutrient Cycling
Nutrient cycling is the process by which sites store and release essential nutrients for plant survival and growth. There are 13 elements, or mineral nutrients, and each fills a specific role or function in plant development and each possesses individual characteristics of movement and storage in the soil. This manual will not attempt to explain the role and function of each mineral nutrient (there are many good textbooks on this subject). It will instead focus on how nutrients cycle through vegetation and soils; how they are captured, stored, and released; and what site components are essential to support these processes. In contrast to an agricultural system of managing optimum growth in crops through fertilization, the goal in wildlands revegetation is to create an environment that will support a self-sustaining native plant community that can develop through successional processes. This includes facilitating the establishment of nutrient cycles in a way that conserves, cycles, and builds nutrients in the system.
Mineral nutrients are stored in: soil, live or dead vegetation, and rock. They are slowly released over time at varying rates. The rates at which nutrients are released from each source will determine their availability for plant uptake. Rock and fallen trees, for example, both hold essential nutrients but release them to the soil at significantly differing rates. The fallen tree can take up to 100 years to decompose and release its nutrients; the weathering of rock might take over 100,000 years. Soil, on the other hand, can release nutrients in the order of weeks and months. Once released, these nutrients are taken up by plants, lost through leaching or erosion, or reabsorbed in the soil.
On undisturbed sites, there is a dynamic exchange of nutrients throughout the year. Plants absorb nutrients from the soil through the root system and assimilate them into vegetative biomass. As plants, or portions of plants, die, they drop leaves, branches, and stems to the ground where they eventually decompose and return nutrients to the soil. The nutrients are stored in the soil and once again become available for plant uptake. This natural process of nutrients moving from soil to vegetation and back again is referred to as nutrient cycling. The factors important in nutrient cycling are as follows:
- Topsoil
- Site organic matter
- Soil nitrogen and carbon
- Nutrients
- pH
- Salts
In a healthy plant community, nutrients are constantly recycled with a minimum amount of nutrients lost from the site. On drastically disturbed sites, however, nutrient cycling functions poorly, if at all. The topsoil, which holds the greatest concentrations of available nutrients and supports the primary microbial activity on the site, is missing or mixed with the subsoil. Organic matter, which is a primary source of long-term nutrient supply and an energy source, has also been removed. Soil nitrogen, the most critical nutrient for plant growth and site revegetation, is lacking. Soil nitrogen governs how quickly vegetation will return to a disturbed site and how much biomass it will ultimately support (Bloomfield and others 1982). Its availability is closely regulated by the amount of carbon present in the soil, which is also in flux on highly disturbed sites.
For many sites that lack topsoil, the subsoil in its place may have pH values that are higher or lower than the pH of the original topsoil. pH values at extreme ranges affect nutrient cycling by making many nutrients insoluble and unavailable for plant uptake. In addition, increased soil salinity, which can be caused by soil disturbance and amendments, can disrupt nutrient availability and provide unfavorable conditions for plant establishment.
Topsoil
The topsoil is the horizon directly below the litter layer that is characterized by high organic matter, abundant roots, healthy microbial activity, good infiltration rates, high porosity, high nutrient content, and high water-holding capacity (Jackson and others 1988; Claassen and Zasoski 1998). Most nutrient cycling takes place in the topsoil where the greatest biological activity occurs. Decomposing microorganisms flourish, feasting on dead vegetation and roots, releasing stored nutrients back to the soil. Most life forms occur in forest, prairie, and range topsoils, including mammals, reptiles, amphibians, snails, earthworms, insects, nematodes, algae, fungi, viruses, bacteria, actinomycetes, and protozoa (Trappe and Bollen 1981). The top 6 inches of an acre of forest topsoil can contain as much as a ton of fungi and a half of a ton of bacteria and actinomycetes apiece (Bollen 1974). Topsoil depth is highly correlated with the nutritional status of the soil and, in forests of the western United States, has been found to be highly correlated to site productivity (Steinbrenner 1981). Topsoils possess humus, which is what gives topsoils their dark color (Figure 3-35). Humus is a stable end-product of decomposition, important for nutrient storage, soil structure, and water-holding capacity.
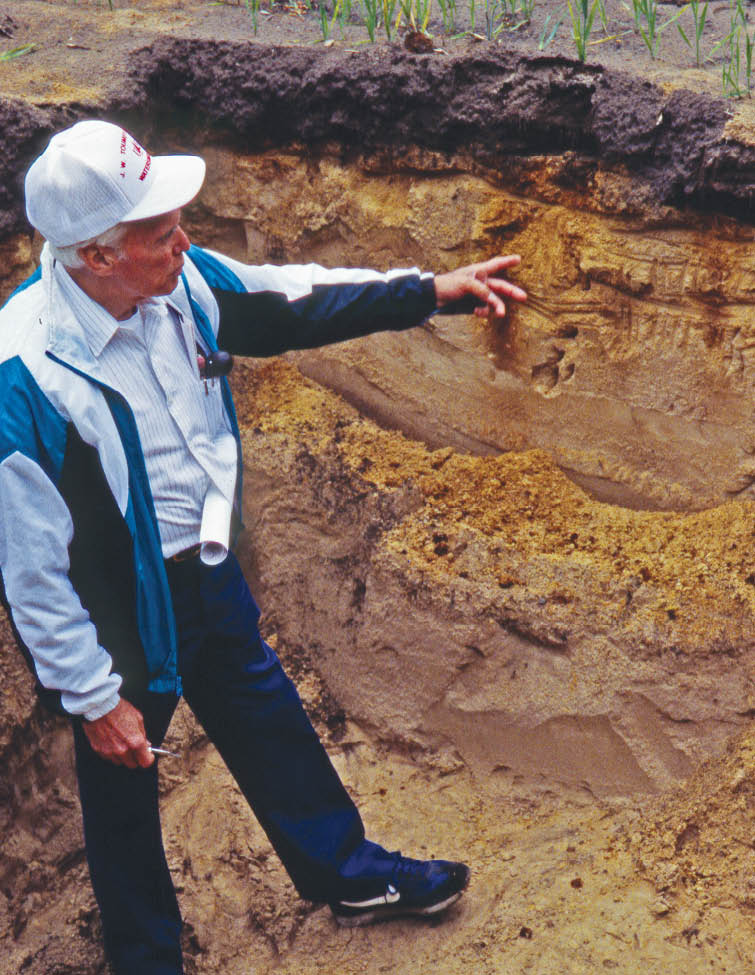
Figure 3-35 | Topsoil
Topsoil is the upper soil horizon and is generally darker, more friable, and has more roots than subsoil.
Photo credit: Thomas D. Landis
Sites lacking topsoil have significantly reduced productivity, and obtaining even minimal revegetation can be very difficult. Planted seedlings often fail or growth is significantly reduced, resulting in inadequate plant cover to protect the soils from erosion. Growth of planted trees can be reduced by one-third to one-half when planted in subsoil instead of topsoil (Youngberg 1981). Restoring these sites to functioning plant communities is unlikely without mitigating measures.
How to Assess Topsoil—On undisturbed sites, topsoil is visually differentiated from the underlying subsoil by having darker colors, less clay, better soil structure, and higher abundance of fine roots. In forest soils, topsoil depths can be more difficult to differentiate from subsoils because the color changes are not always distinct. Other attributes, such as the abundance of roots, lack of clays, soil structure, and lower bulk density, can be used instead. On construction sites, topsoil has either been removed and stockpiled or mixed in with the subsoil.
Mitigating for Lack of Topsoil
Minimize Soil Disturbance on "Fragile Soils"—Where soils are especially fragile and reconstructing topsoil conditions is difficult, it is particularly important to keep the "disturbance footprint" to a minimum (Claassen and others 1995). Sites with fragile soils include decomposed granitic soils, serpentine soils, high elevation soils, and very acidic or basic soils.
Salvage and Reapply Topsoil—An effective practice in revegetating highly disturbed sites is salvaging and reapplying topsoils (Section 5.2.4). This practice has been found to greatly increase plant growth and ground cover (Claassen and Zasoski 1994). Topsoil salvage and application require good planning, implementation oversight, and topsoil surveys. In the planning phase, a survey of the planned road corridor identifies the location of topsoil, the depth, and nutrient status through laboratory testing (Section 3.10.1). After topsoil is removed and appropriately stored, it is reapplied to the disturbed site, ideally at depths similar to pre-disturbance reference sites.
Create Manufactured Topsoil—When topsoil is not available, "manufactured topsoil" can be created in situ or produced offsite and imported (Section 5.2.4, see Manufactured Topsoil). Manufactured topsoil will lack the native seed bank and some of the biological components of topsoil, but it can re-create a rooting zone high in nutrients and organic matter, with good water-holding capacity, porosity, and infiltration.
Create Planting Islands—If sources of manufactured or natural topsoil are scarce or too costly for broad scale applications, placing available topsoil in strategic locations, such as planting islands, can create a mosaic of productive growing sites.
Site Organic Matter
Site organic matter (OM) consists of plant materials in all stages of decomposition, including wood, bark, roots, branches, needles, leaves, duff, litter, and soil organisms. From a nutrient cycling standpoint, site organic matter assimilates nutrients drawn from the soil into live vegetation. Depending on the type of vegetation and the productivity of the site, the amount of nutrients held in organic matter can be significant. Figure 3-36 shows the quantities of four major nutrients held in the organic matter of a young Douglas-fir stand, and Figure 3-37 shows the quantity of major nutrients found in the application of 2 inches of material derived from Douglas-fir and alder. These two examples show the possible nutrient reserves that organic matter can contribute to a disturbed site if they are kept on the site or processed into mulch or soil amendments and reapplied.
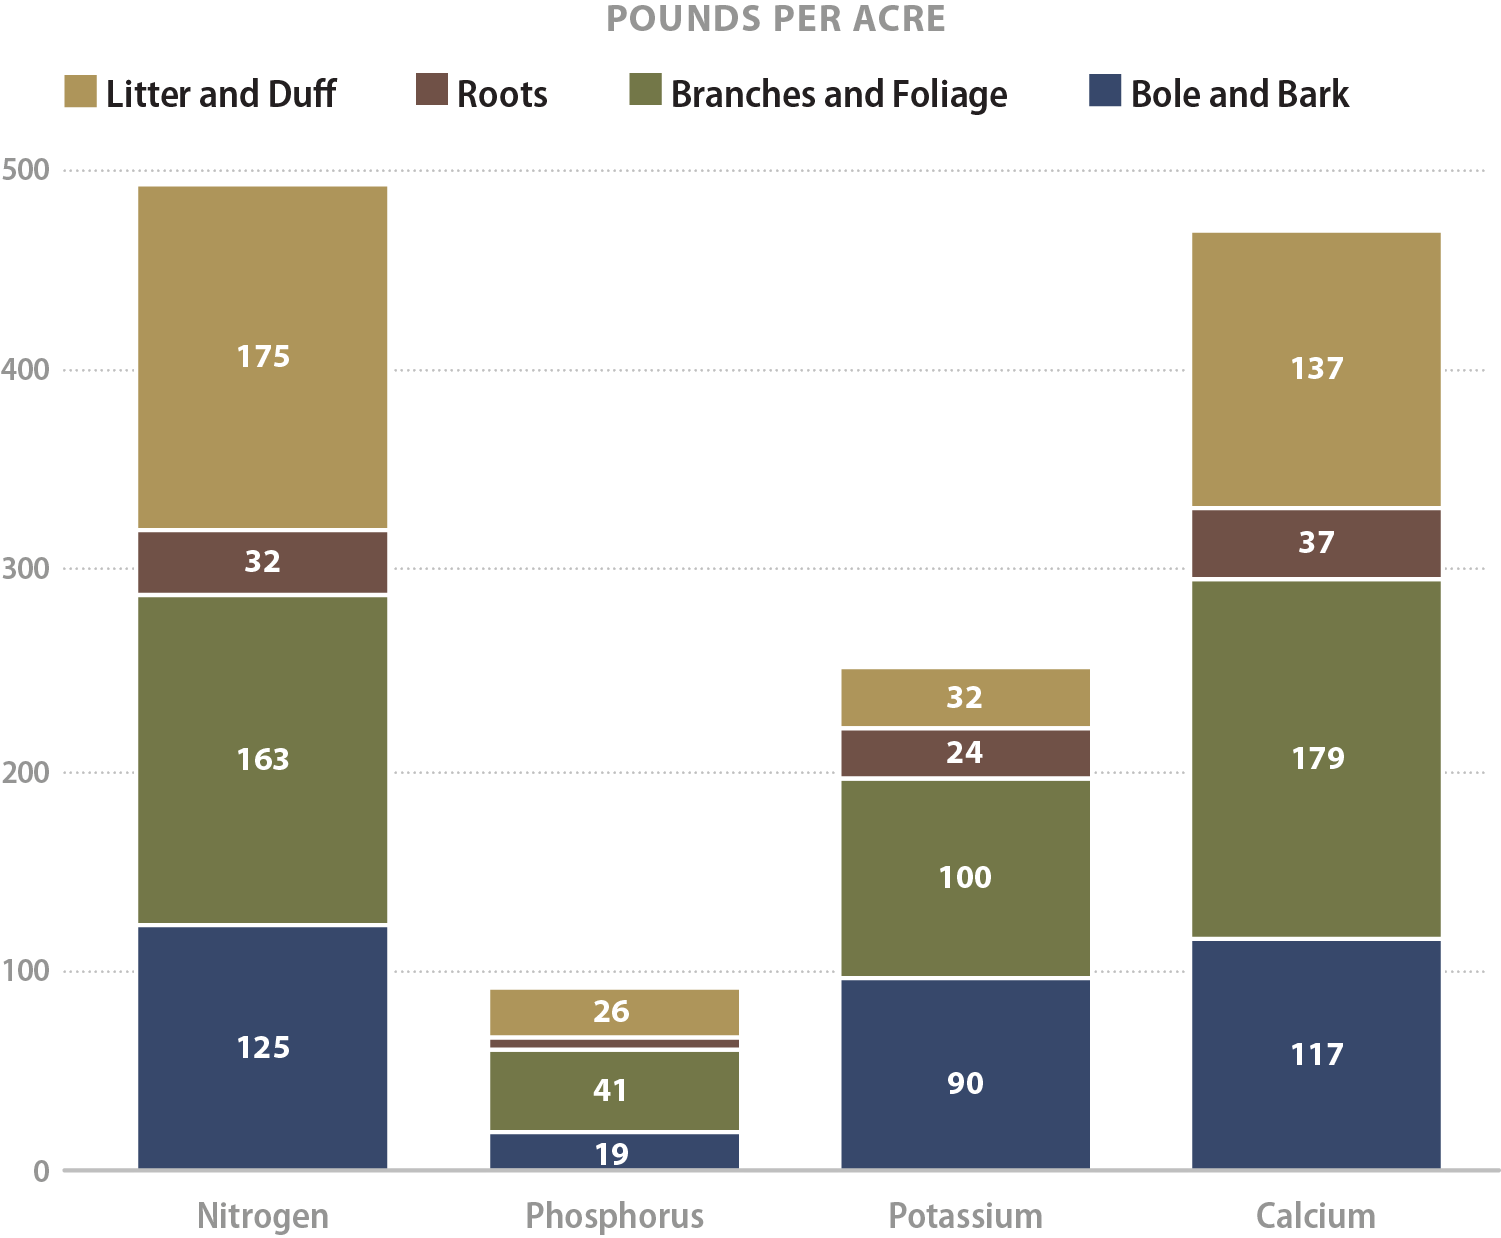
Figure 3-36 | Nutrients in forests stands
Most of the nutrients found in a young Douglas-fir stand reside in the litter, duff, and branches (adapted from Cole and Johnson 1981).
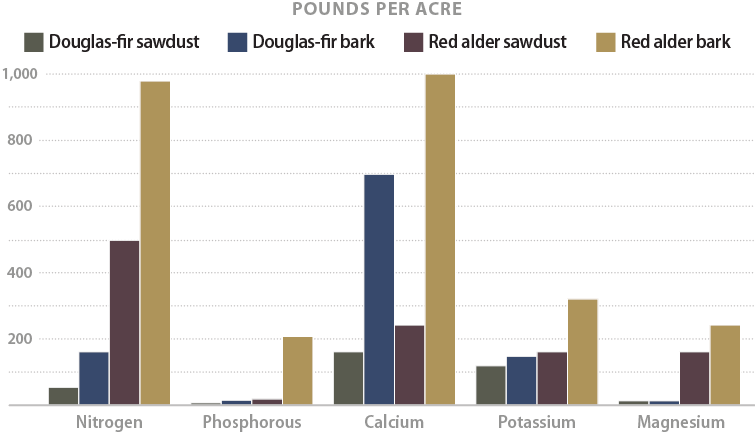
Figure 3-37 | Nutrients in Douglas-fir and alder
Comparison of pounds per acre of nutrients resulting from bark or wood from Douglas-fir and alder trees, based on 2 inches of applied organic matter (Rose and others 1995).
While plants are essential in nutrient cycling, equally important are the decomposing organisms that release nutrients to the soil. Decomposers consist of thousands of specialized species of animals, insects, fungi, bacteria, and actinomycetes that survive on organic matter. Decomposing organisms not only release nutrients but are essential to the development of soil structure (Section 3.8.2, see Soil Structure).
On an undisturbed site, organic matter is in all stages of decomposition, from recently dead trees to soil humus, the end product of hundreds of years of decomposition. This understanding is important for restoring a site to a functioning plant community because it is a reminder that nutrients are released throughout the life cycle of a plant community, not just at the beginning of a revegetation project. A site that has a range of organic matter in all stages of decomposition not only conserves nutrients but slowly meters them out over time. In addition, organic matter is an essential nesting habitat for many pollinator species. For example, tunnel-nesting bees nest in dead standing trees or piths of stems and twigs of shrubs, grasses, and forbs.
The rate at which organic matter decomposes and releases nutrients is a function of: soil to OM contact, OM particle size, the ratio of carbon to nitrogen (C:N ratio), temperature, and moisture. Decomposition rates of organic matter are highest in soil because the greatest microbial activity occurs when soil is in direct contact with OM (Slick and Curtis 1985; Rose and others 1995). Organic matter placed on the surface of the soil as mulch will decompose at a much slower rate than organic matter incorporated into the soil because there is less contact with the soil.
Organic matter particle size plays an important role in the rate of decomposition. Within the soil profile, the smaller-sized OM fractions decompose faster than the larger fractions due to greater surface area in contact with soil. Roots, leaves, needles, and very finely ground sawdust or bark often decompose much faster than larger materials, such as buried logs or large diameter branches. Materials with C:N ratios, such as wood or bark, decompose much slower than materials with low C:N ratios, such as green leaves and grass cuttings. As Figure 3-38 illustrates, high C:N organic matter will take much longer to decompose than low C:N material, but both will decompose faster when they are reduced in size.
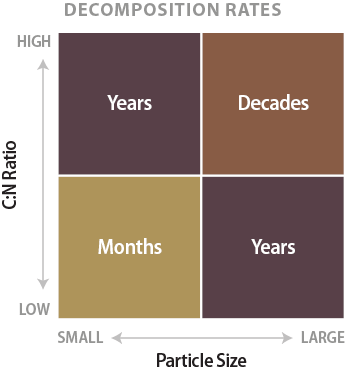
Figure 3-38 | Relative rates of decomposition by C:N ratio and particle size
Moisture and temperature also control decomposition rates; cold and dry environments have very slow rates compared to warm, moist sites.
How to Assess Organic Matter—Duff and litter on reference sites can be measured through transects or plots (Section 5.2.3, see Litter and Duff). Estimating forest biomass of down, woody materials in different size classes can be done using photo series guides (Maxwell and Ward 1976a, 1976b, 1979). Fire specialists are experienced in estimating the amount of biomass in forested environments.
Mitigating for Lack of Site Organic Matter
Salvage and Reapply Litter and Duff—Duff and litter can store a significant amount of nutrients, especially on sites where layers are deep. It can be salvaged separately (Section 5.2.3., see Litter and Duff) or mixed together when topsoils are salvaged (Section 5.2.4).
Process and Apply Organic Matter—Road projects constructed through forested sites can generate high amounts of biomass. These materials can be good sources for slow-release nutrients and carbon. Methods of processing this material and reapplying it to constructed slopes are discussed in Section 5.2.3, see Litter and Duff. Processed organic matter can be applied directly to the soil surface as a mulch or mixed into the soil as a soil amendment. High C:N organic materials, such as sawdust and bark, can be placed on the soil surface to prevent long-term nitrogen tie-up in the soil or composted for several years to lower the C:N ratio before adding as a soil amendment. Lower C:N materials, such as leaves, needles, and branches, can be incorporated in the soil with some addition of slow-release nitrogen to reduce the effects of nitrogen tie-up.
Apply Composts to Soil Surface—When compost is applied to the surface of the soil (compost blanket), it functions as a soil cover to protect the soil from surface erosion while slowly decomposing and adding nutrients as the plant community develops. Decomposition rates of surface-applied compost are slower than if it were incorporated into the soil because there is very little soil contact at the soil surface. Nutrients are released at a slower rate and are available to the site longer. Leaving the soil surface very rough prior to the application of compost creates more soil-to-compost contact, which can increase the rate of decomposition of the compost. Tackifiers are added to compost to reduce the potential for the material to move off the site. Compost blankets function very differently than mulches; compost blankets are great media for seed germination and plant establishment whereas mulches are not (Section 5.2.3).
Salvage and Place Large Wood—Large wood can be salvaged and placed in areas such as abandoned roads for long-term site productivity, microsite planting, pollinator nesting habitat, and soil erosion control structures (Figure 3-39). When placed in contact with the soil, large wood helps stabilize the surface of the soil from sheet and wind erosion, and can be used as buttresses to stabilize slopes. Seedlings planted on the north side of the logs can be protected from wind and sun during establishment. Large and small wood can be placed at the outlets of culverts as obstacles to capture and store sediments, reducing the amount of sediment reaching live streams (Burroughs and King 1989; Ketcheson and Megahan 1996). When large wood is placed upright, it can be used as barriers to off-road vehicle traffic, nesting habitat for many pollinator species, and feeding and nesting habitat for a range of wildlife species.
Figure 3-39 | Large wood creates pollinator habitat and reduces soil erosion
Placement of large wood adds long-term organic matter while creating microsites for planting seedlings and habitat for pollinators and wildlife. Large wood can also slow runoff and detain sediments from surface soil erosion.
Photo credit: David Steinfeld
Soil Nitrogen and Carbon
Nitrogen (N) is discussed separately from the other mineral nutrients because of its critical importance to plant growth and long-term development of plant communities. Carbon (C) is included in this discussion because of its unique relationship to nitrogen availability. Carbon governs the amount of available nitrogen in the soil while nitrogen regulates the rate at which carbon is broken down. Both factors play a critical role in microbiological activity and the development of soil properties.
Carbon to Nitrogen Ratio (C:N Ratios)—Carbon is the energy source for soil microorganisms, and practically all site nitrogen eventually passes through these microorganisms (Woodmansee and others 1978). The rate at which carbon (or organic matter) decomposes is directly related to the amount of available nitrogen and the type of dominant microbes present in the soil. The greater the nitrogen, the greater the decomposition rates. If decomposing organisms do not find sufficient nitrogen in the organic matter, they will withdraw it from the soil, leaving little or no nitrogen for plant growth. This is usually a temporary condition but could last several years. The tie-up of nitrogen can greatly affect the establishment of vegetation if organic amendments, such as wood chips, are incorporated into the soil without supplemental nitrogen.
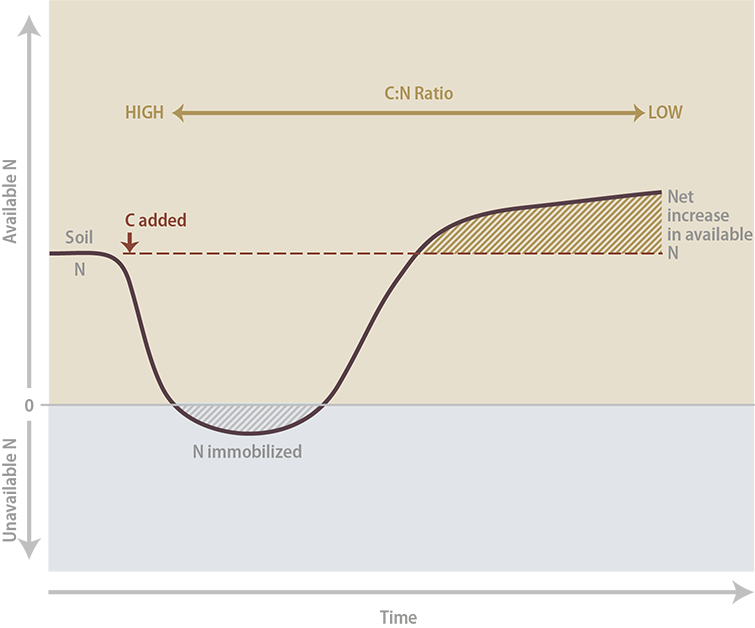
Figure 3-40 | Release of available nitrogen through decomposition
Available nitrogen (N) levels change as organic matter carbon (C) is added to the soil. High ratios move to low ratios during decomposition. Nitrogen is tied up in microorganisms during the immobilization phase (blue shaded area) and unavailable to plants. With time, nitrogen becomes available again and, at some point, exceeds the original level (green shaded area). Nitrogen is then released at a constant rate (modified after Havlin and others 1999).
With time, nitrogen is eventually released from the organic matter by microbial activity. This nitrogen, plus nitrogen released from dead and decomposing microorganisms, becomes available for plant growth. As organic matter breaks down further, there becomes a net increase in available nitrogen. In the last stage of decomposition, microorganisms move to a steady rate of decomposition, releasing a constant nitrogen supply (Figure 3-40). This process can take several years or more depending on site factors and organic matter levels. The C:N ratio is an indicator of whether nitrogen will be limiting or in surplus. A C:N ratio of 30:1 or greater indicates that decomposing organisms have consumed the available nitrogen in the soil, leaving little if any available nitrogen for plant growth. Plants respond by turning yellow and stunted. A C:N ratio below 18:1 is an indication that the decomposing organisms are releasing available nitrogen from the breakdown of organic matter at rates that exceed their need, thereby increasing nitrogen for plant uptake (Claassen 2006). For example, undisturbed topsoils typically have ratios of 10:1 to 12:1, which indicates that nitrogen is sufficiently available for plant growth (Tisdale and Nelson 1975). Dry hay, on the other hand, has a C:N ratio around 40:1, indicating nitrogen will probably be limiting for some period of time if the hay is incorporated into the soil.
The use of high C:N materials is often discouraged because of concerns about tying up nitrogen. However, there are strategies where the use of high C:N materials can aid in achieving project goals. One use of high C:N materials is to apply it to the soil surface or incorporate it into the top several inches of soil to intentionally tie up nitrogen. The lower availability of N at the surface creates a less than optimum growing environment for the establishment of annual weedy species, which thrive on high nitrogen environments.
Soil Nitrogen Capital
Soil nitrogen capital can be categorized into three nitrogen pools, or reserves, based on its availability in the soil:
- Available nitrogen (referred to as "extractable nitrogen")
- Slowly available nitrogen (referred to as "mineralizable nitrogen")
- Unavailable nitrogen ("humified organic" or "fresh" forms)
Nitrogen capital can be viewed much like our banking system. Cash received from the bank teller is comparable to "available nitrogen." When money runs low, the teller replenishes it with money from the bank vault (similar to "slowly available nitrogen"). Banks are backed up by money held in an extremely large banking reserve system ("unavailable nitrogen"). While this money is not accessible, it is very important for the long-term stability of the banking system. Unavailable nitrogen is like the banking reserve system in that it backs up the nitrogen system and ultimately releases nitrogen to the plant community.
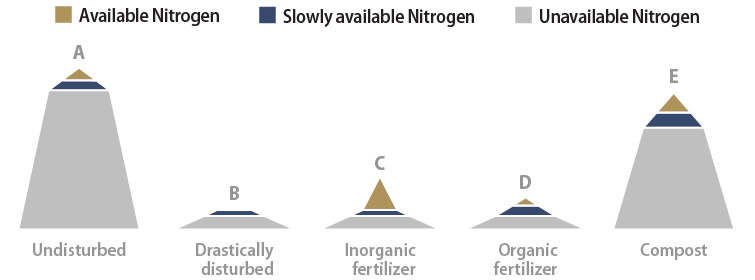
Figure 3-41 | Managing nitrogen capital
Undisturbed sites (A) have very high total nitrogen levels, with over 95 percent tied up in organic matter and not available (gray). Slowly available nitrogen (blue) makes up 1 percent to 3 percent of the total nitrogen; available nitrogen for plant uptake (tan) is less than 2 percent of the total nitrogen. Nitrogen capital is essentially removed on drastically disturbed sites (B). The addition of inorganic fertilizer (C) dramatically increases available nitrogen but does little to build nitrogen capital. The application of organic fertilizers (D) raises the available and the slowly available nitrogen but does not add to the long-term reserves. Adding compost to the soil can increase available, slowly available, and total nitrogen reserves (E) to levels comparable to undisturbed soils (A).
As with the banking reserve system, having high reserves of both slowly available and unavailable nitrogen ensures that available nitrogen levels will be released at constant rates over time which is necessary for the development of a sustainable plant community. Figure 3-41 shows the relationship of different revegetation treatments on nitrogen capital.
On highly disturbed sites, all nitrogen reserves are low. The course of action in typical revegetation projects is to apply inorganic fertilizers during the seeding operation. While this immediately makes nitrogen available, it does little for increasing long-term nitrogen reserves. Within a year of application, most soils will need more available nitrogen to sustain plant growth. Alternatively, organic fertilizers provide a combination of available and slowly available nitrogen. These fertilizers release nitrogen over several years but are typically applied at rates not great enough to bring the nitrogen reserves up to levels for long-term plant community establishment (Claassen and Hogan 1998). Applying topsoil, composts, or low C:N organic matter into the soil are mitigation treatments that create the reserves of unavailable and slowly available nitrogen important for a constant supply of available nitrogen over time.
Minimum Soil Nitrogen Levels
Total soil nitrogen is the sum of available, slowly available, and unavailable nitrogen reserves. The level of total soil nitrogen varies by plant community and ecoregion. It can range from 20,000 lb/ac in deep forest soils of the Washington and Oregon coast (Heilman 1981) to as low as 800 lb/ac in desert grasslands of southern New Mexico (Reeder and Sabey 1987). Shortgrass prairies in northeastern Colorado and shrub-steppe prairies of the Great Basin have a range of total nitrogen from 4,000 to 5,000 lb/ac (Reeder and Sabey 1987). Sites that are drastically disturbed often have nitrogen rates below 700 lb/ac. These sites cannot fully support vegetative cover. A minimum, or threshold, level of total soil nitrogen required for a self-sustaining ecosystem has been suggested at 625 lb/ac (Bradshaw and others 1982) to 670 lb/ac (Dancer and others 1977) for drastically disturbed sites. But Claassen and Hogan (1998) suggest much higher rates might be necessary. In their research on granitic soils in the Lake Tahoe area, they found a good relationship between total soil nitrogen and the percentage of plant cover. Sites with greater than 40 percent ground cover contained at least 1,100 lb/ac total soil nitrogen in the surface foot of soil. This implies that to maintain a minimum of 40 percent plant cover, sites like these must contain at least 1,100 lb/ac of nitrogen, with higher nitrogen levels necessary for higher plant cover (Figure 3-42).
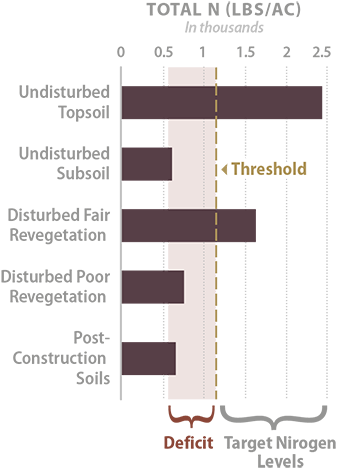
Figure 3-42 | Determining total N threshold values from reference sites
In this example, the total N threshold was estimated at 1,100 lb/ac (average of disturbed reference sites with "poor" and "fair" revegetation). Total N in post-construction soils was 650 lb/ac, making these soils deficient by 450 lb/ac. The undisturbed topsoils of reference sites showed a total N of 2,430 lb/ac, which set the target levels of nitrogen between 1,100 and 2,430 lb/ac.
Target levels for available nitrogen released annually from nitrogen sources for plant growth range from below 27 to 50 lb/ac (Munshower 1994). These are nitrogen levels that should be considered when calculating fertilizer rates (Section 5.2.1, see Determine Fertilizer Application Rates).
How to Assess Soil Nitrogen and Carbon—Soil testing for nitrogen can be conducted for: topsoils that will be salvaged, reference sites, and post-construction soil materials. Procedures for collecting soil samples are presented in Inset 3-3. The following nitrogen tests are available:
- Total nitrogen—Total nitrogen is an important test to request; the results will be used to determine nitrogen thresholds and nitrogen amendment needs. The common total nitrogen tests are Leco and Kjeldahl. Total nitrogen has been found to correlate well with plant cover (Claassen and Hogan 1998).
- Mineralizable nitrogen—This test requires the soil samples to be incubated for a period of time and then tested for available nitrogen. The results indicate the amount of slowly available nitrogen present in the sample. While this test is not widely used, it nevertheless is a very good test to perform because the results correlate well with expected plant cover (Claassen and Hogan 1998). There are several types of incubation tests, so it is good to confer with the soil laboratory as to which tests would be most appropriate.
- Extractable nitrogen—This test is less meaningful because it only indicates available nitrogen, not what is in reserve. This test is often included in a soil testing package. The extractable N pool has the lowest correlation to the amount of plant cover growing on a site (Claassen and Hogan 2002). The most common test for extractable nitrogen is 2N KCl extract.
Nitrogen testing for composts and organic matter should be done by laboratories specializing in these tests. These laboratories should follow the testing procedures outlined in the Test Methods of the Examination of Compost and Composting (TMECC) explained in Inset 5-6.
Nitrogen Analysis—Soils laboratories report nitrogen in a variety of units, such as gr/l, ppm, mg/kg, ug/g, and percent. Unless these values are converted to pounds per acre, it is difficult to determine rates of fertilizer, compost, or topsoil necessary to restore site nitrogen. Use Table 3-9 (Line E) to convert lab values to total pounds per acre of nitrogen. These calculations account for soil bulk density, soil thickness, and coarse fragment content, which affect the total nitrogen levels of a site.
Nitrogen Thresholds and Deficits—Each plant community has a total nitrogen requirement that must be met in order to develop into a functioning and self-sustaining system. For successful revegetation efforts, a practical goal is to meet the minimum target, or threshold level, for total nitrogen. Threshold values, however, are not found in textbooks and must be developed from soil tests of disturbed and undisturbed reference sites. Conducting nitrogen tests on disturbed reference sites where revegetation efforts have succeeded, as well as reference sites where revegetation efforts have failed, can help determine a threshold value (Figure 3-42). Alternatively, conducting soil tests on undisturbed reference sites will define the optimum nitrogen levels and also bracket target nitrogen levels. Converting soil test results into total nitrogen per acre is shown in Table 3-9, line E.
Post-construction soils are typically deficient in nitrogen. In order to develop a strategy for bringing soil nitrogen above threshold levels, it is important to determine the approximate nitrogen deficit. Table 3-9 shows how this is calculated by subtracting the total nitrogen value of post-construction soils (Line E) from the threshold nitrogen value (Line F).
Table 3-9 | Calculating the nitrogen deficit of a site—an example
|
|
||
A |
Total soil nitrogen (N) |
0.025% |
From soil test of post construction soils (if rates are expressed as gr/l, ppm, mg/kg, ug/g, divide by 10,000 to convert to percentage) |
B |
Thickness of soil layer |
0.5 feet |
The thickness of soil represented in (A). |
C |
Soil bulk density |
1.4 gr/cc |
Unless known, use 1.5 for compacted subsoils, 1.3 for undisturbed soils, 0.9 for light soils such as pumice |
D |
Fine soil fraction |
70% |
100% minus the rock fragment content (from estimates made from sieved soil prior to sending to lab) |
E |
N in soil layer |
331 lbs/ac |
Calculated amount of total nitrogen in soil layer. To convert to kg/ha: E * 1.12 |
F |
Minimum or threshold N levels |
1,100 lbs/ac |
Determined from reference sites or literature |
G |
N deficit: F - E = |
769 bs/ac |
Minimum amount of N to apply to bring up to threshold |
Carbon Analysis—Carbon is determined directly using the combustion method (Leco instrument) or indirectly with the Walkley-Black and/or loss-on-ignition methods. Depending on the testing methods, carbon will either be reported as percent of organic matter or percent of carbon. To convert percent of organic matter to percent of carbon, multiply the value by 0.5 to 0.58 (Tisdale and Nelson 1975).
When soils laboratories receive soils samples, they sieve out any materials greater than 2 mm. For this reason, it is important to sieve rock fragments, but not larger organic matter, from the soil samples prior to sending them to the lab. Request that the lab not sieve the larger organic matter from the sample so that the results report out in total carbon and nitrogen.
C:N Ratio—The C:N ratio is calculated by dividing the percent of carbon by percent of nitrogen from the laboratory results obtained for nitrogen and carbon tests.
Mitigating for Low Soil Nitrogen
Develop a Strategy—It is important to develop a strategy for increasing nitrogen over time, especially on sites that are deficient in nitrogen. The strategy takes into account the accumulation of nitrogen by all available sources—topsoil, mulch, compost, fertilizers, and nitrogen-fixing plants. Figure 3-43 shows an example of a strategy for increasing total soil nitrogen to a threshold level.
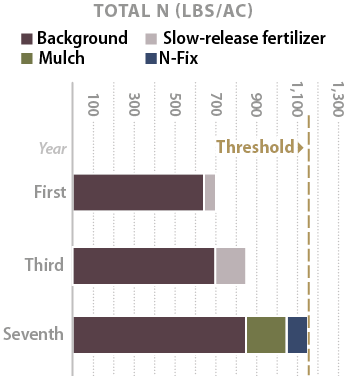
Figure 3-43 | Raising nitrogen levels
Raising nitrogen levels on nitrogen-deficient sites to threshold levels requires developing a long-term strategy. In this example, the site began with a background N of 650 lb/ac. After application of a slow-release fertilizer at 1,000 lb/ac during the first year, the site accumulated 50 lb N (assumes N was captured by plants or soil microorganisms and not leached from the soil). In the third year, an additional 3,000 lb slow-release fertilizer was applied, which increased total N to 850 lb/ac. By the seventh year, woody mulch that was applied during sowing had mostly decomposed, releasing approximately 200 lb N. Nitrogen-fixing plants were well established by then and had contributed approximately 100 lb N.
Topsoil—Salvaging and reapplying topsoil is an excellent way to increase total soil nitrogen on drastically disturbed sites. The depth to apply topsoil should be similar to the soil depth found in undisturbed reference sites or pre-construction soils. If topsoil material is limited, then using the calculations shown in Table 3-9 can help determine the minimum depths to apply topsoil. Section 5.2.4 discusses methods to salvage and apply topsoil. To determine if there is a tie-up or surplus of nitrogen in the salvaged topsoil, soil tests can be conducted for C:N ratios. Topsoils with C:N ratios greater than 25:1 could benefit from the addition of nitrogen, while ratios less than 8:1 will have the necessary nitrogen for plant growth.
Composts—Applied on the soil surface and incorporated, composts can supply sufficient soil nitrogen for long-term site needs. Application rates for composts can be calculated using the methods shown in Table 3-9. Testing and application methods for compost are discussed in Section 5.2.3 and Section 5.2.5.
Nitrogen-Fixing Plants—Significant quantities of nitrogen can be supplied by nitrogen-fixing plants (Section 5.2.7, see Nitrogen-Fixing Bacteria). Establishing nitrogen-fixing plants is a means of meeting short-term goals by reducing the need to apply fertilizers and long-term goals by increasing the total nitrogen on the site.
Fertilizers—Applying nitrogen-based fertilizers to drastically disturbed soils is another means of increasing nitrogen levels, but it requires an understanding of fertilizers (composition and release), how the soils will capture and store nutrients, and how plants will respond to increased levels of available nitrogen. As the calculations in Table 3-9 demonstrate, nitrogen-based fertilizers cannot deliver enough nitrogen in one application for long-term site recovery of drastically disturbed sites. However, applied judiciously within an overall nitrogen strategy using topsoil, composts, and nitrogen-fixing plants, nitrogen-based fertilizers can be an effective tool in site recovery.
Not all sites or conditions require fertilizers. It might not be necessary to fertilize soils that have high total N levels and low C:N ratios. In fact, applying fast-release fertilizers may be a disadvantage on some sites by favoring weedy annuals over perennial species. A discussion on selecting fertilizers, calculating application rates, and determining methods of application is provided in Section 5.2.1.
Biosolids—Biosolids are rich in slow and fast releasing nitrogen and, if sources are available nearby, are a good means of raising soil nitrogen (Figure 5-5)
Nutrients
Macronutrients |
N Nitrogen |
Major fertilizer element most commonly limiting in disturbed soils Easily leached from soils. Legumes and other plants can fix atmospheric nitrogen in natural plant communities |
P Phosphorus |
Major fertilizer element frequently unavailable in disturbed soils. Mycorrhizal fungi can improve uptake in natural plant communities |
|
K Potassium |
Major fertilizer component that can be leached from soils |
|
Secondary Macronutrients |
Ca Calcium |
Besides being plant nutrients, calcium and magnesium can be applied as dolomitic limestone to raise soil pH |
Mg Magnesium |
||
S Sulfur |
Besides being a plant nutrient, sulfur can be applied to lower soil pH |
|
Micronutrients |
B Boron |
More important for subsequent plant growth than for establishment. Micronutrients are frequently unavailable in disturbed soils, but can be amended with organic fertilizers or specially formulated micronutrient fertilizers |
Mn Manganese |
||
Fe Iron |
||
Zn Zinc |
||
Mo Molybdenum |
||
Cu Copper |
||
Cl Chloride |
Figure 3-44 | The 13 essential mineral nutrients
Success in wildland restoration is determined by its species richness, not biomass production or whether it is a self-sustaining and resilient system, not a system that requires constant energy inputs. By these standards, applying the basic agricultural model to wildland revegetation is limited.
This section broadly discusses the remaining mineral nutrients essential for plant growth (Figure 3-44). There are many references devoted to the role of nutrients in plant nutrition and the designer is directed to these sources for a more detailed discussion of each nutrient (Tisdale and Nelson 1975; Thorup 1984; Munshower 1994; Havlin and others 1999; Claassen 2006). Historically, the majority of research in soil fertility and mineral nutrients was conducted with the agricultural objective of optimizing crop yields through annual inputs of fertilizers, soil amendments, and irrigation. The primary objective of wildland restoration, however, is to restore or re-create self-sustaining plant communities that, once established, require very little input of resources. Unlike agriculture, revegetation of highly disturbed sites is not approached with the objective of optimizing the site for a single, high-yielding crop, but to develop a system of interrelated species that have evolved and adapted to site conditions. In wildland restoration, it is more important to re-create the components of the local soils than to change nutrient status based on agricultural models. For example, from an agricultural perspective, a serpentine soil has an imbalance of calcium and magnesium. Unless fertilizers containing a "correct" ratio of calcium and magnesium are applied to adjust this imbalance, the soils will be unsuitable for crop species. In wildland restoration, the approach is guided by the nutrient needs of the species endemic to the site, not to a generic agricultural crop. Because serpentine plant species have evolved on soils with these nutrient ratios, their nutrient requirements are vastly different than those of agricultural crops, or even native vegetation growing on adjacent, non-serpentine soils. In this example, the calcium-to-magnesium ratio would not be seen as an imbalance for native serpentine plant establishment, but perhaps as a "requirement" for certain endemic species to recolonize the site. This requires the designer to compare post-construction mineral nutrient status to that of undisturbed or recovered reference sites to determine if there are deficiencies. Amendments can then be applied to bring nutrients and other soil factors to pre-disturbance levels or to levels that meet project revegetation objectives.
How to Assess Nutrients—The objective of nutrient analysis is to compare nutrient levels of post-construction, disturbed soils with those of pre-disturbance, or reference site, soils. Where there are large discrepancies, a strategy can be developed to bring low post-construction levels up to minimum nutrient levels. Because this is a comparative analysis, it is essential that the sampling, collection, and testing methods are identical.
Nutrient tests are often performed on salvaged topsoil, reference sites, post-construction slopes, and areas where there have been failures in revegetation. A guide to sampling soils for nutrient analysis is presented in Inset 3-2. Nutrient testing can be used to evaluate total soil nutrient levels for long-term nutrient availability, as well as available levels, for immediately available nutrients for plant growth. Table 3-10 lists common soil tests.
Table 3-10 | Soil testing methods
Common soil testing methods for the western United States (Horneck and others 1989; Munshower 1994; Teidemann and Lopez 2004).
Note: Composts use a different set of tests due to high organic matter (Table 5-9).
Tests |
Type |
Test method |
Notes |
Boron |
Available |
Hot-Water |
|
Boron |
Available |
Aqueous extract of a soil paste |
|
Calcium, Magnesium |
Available |
Ammonium Acetate |
|
Calcium, Magnesium |
Available |
Aqueous extract of a soil paste |
In semi-arid to arid soils |
Molybdenum |
Available |
Ammonium oxalate-oxi acid extraction |
|
Nitrate |
Available |
Aqueous extract of a soil paste (Saturated paste) |
Accepted extrant for western soils |
Nitrate |
Available |
CaO extract & Cd reduction |
|
Nitrogen (ammonium and nitrate) |
Available |
KCL Extraction |
|
Nitrogen |
Slowly - Available |
Anaerobic Incubation |
|
Nitrogen (total) |
Total |
Kjeldahl N |
|
Nitrogen (total) |
Total |
Combustion (Leco Instrument) |
|
Organic matter |
Total |
Loss - Ignition |
Best used for soil high in organic matter |
Organic matter |
Total |
Walkley-Black Method |
|
Organic matter |
Total |
Combustion (Leco Instrument) |
Reports out in Total C |
pH |
Aqueous extract of a soil paste (saturated paste) |
||
Phosphorus |
Available |
Olsen Sodium Bicarbonate |
For arid and semi-arid soils |
Phosphorus |
Available |
Dilute Acid-Flouride (Bray-P1) |
For mesic sites |
Phosphorus |
Available |
AB-DIPA |
Reports out at half the rates of Olsen method |
Potassium |
Available |
Sodium Acetate |
|
Potassium |
Available |
Olsen Sodium Bicarbonate |
For arid and semi-arid soils |
Potassium |
Available |
Ammonium Acetate |
|
Sodium |
Available |
Ammonium Acetate Displacement |
|
Sodium |
Available |
CTPA |
|
Sulfate Sulfur |
Available |
Aqueous extract of a soil paste (saturated paste) |
|
Sulfate Sulfur |
Available |
CaHPO4 & ICP |
|
Zinc, Copper, |
Available |
CTPA |
Iron is not performed in Oregon because not found deficient |
With soil laboratory results from reference sites and post-construction sites, determine which nutrients, if any, are deficient using the process outlined in Section 5.2.1, see Develop Nutrient Thresholds and Determine Deficits. If a nutrient is found deficient, fertilizers, composts, topsoil, or other organic amendments can be applied to the soil to bring the nutrient above threshold levels. A process for determining fertilizer type, application rates, and application methods is presented in Section 5.2.1.
Inset 3-2 | Soil testing
Soil testing is a means of describing those soil characteristics that cannot be observed or accurately measured in the field. The tests include analysis of chemical properties, including pH, soluble salts, macronutrients, micronutrients, and organic matter, as well as physical properties such as density, water-holding capacity, and texture. Soil testing is costly and if not sampled, analyzed, and interpreted properly can lead to unneeded and expensive soil amendments and application practices. In many respects, it is better not to test soils than to test them or interpret the results incorrectly. Some laboratory test results found for many soil series in the U.S. is available at the National Cooperative Soil Survey Soil Characterization Data website.
Soil testing is performed with topsoil recovery surveys and reference site surveys (discussed in other sections) to identify soil physical and chemical factors that will limit plant growth, develop site-specific soil quality targets, and develop a set of revegetation treatments that will increase short- and long-term soil productivity targets. The three components of soil testing are soil sampling, lab analysis, and interpretation of lab results. Adhering to an established procedure for each component of soil testing is critical for developing appropriate revegetation treatments.
Sampling soil—Soil sampling is the field collection of soils in a manner that best represents the soils of an area. The number of soil samples taken within a project area is usually kept to a minimum because of the expense of collecting and handling the samples and the cost of laboratory analysis. Taking too few samples to describe a project site, however, can be misleading, especially if the soils are extremely variable. This leaves the designer with the challenge of determining the best approach to collecting soil samples in a way that most accurately represents the sites being described.
The following guidelines are useful in developing a sampling strategy for soil testing:
- Determine the area to be sampled—The areas to be sampled are called sampling areas and they typically encompass a vegetation unit, an individual topsoil stockpile, similar topsoil salvage areas, or a reference site. For most projects, only one soil sample is collected from a sampling area. For this reason, it is important to select a collection site (an area where soil samples are collected) that best represents the sampling area. Only for small sampling areas, such as topsoil stockpiles or reference sites, will the collection site be the same as the sampling area. For larger sampling areas, such as revegetation units or topsoil salvage areas, the collection site will be a smaller, representative area within the sampling area.
- Collect multiple subsamples—Once a collection site has been identified, a set of subsamples are collected. Collecting soil from one point is never enough. The number of subsamples to collect within a collection site should be based on the site's variability. Small collection sites generally require fewer subsamples than larger areas because these sites are usually less variable. Undisturbed sites are typically more homogenous than disturbed sites and therefore require fewer subsamples. Guidelines for the numbers of subsamples to collect range from 6 for very homogenous sites to 35 for large, heterogeneous sites.
- Randomly collect subsamples—Subsamples should be collected randomly within the collection site. For small areas like reference sites or stockpiled soil, the samples can be collected on a grid system. For very large areas, samples can be collected in a zigzag or "W" pattern at predetermined intervals.
- Determine sampling depth—The objectives for soil sampling are reviewed and the sampling depth is determined. If the objective is to characterize the soil for topsoil recovery, then the soil samples must be collected only in the topsoil horizon, in which case the depth of the topsoil will have to be determined prior to sampling. If it is known that the surface soil including duff and litter will be removed to 15 inches during topsoil salvage, then collection depth would be a sample 15 inches deep that included the duff and litter layers. If soil sampling objectives are to determine the nutrient levels of a topsoil pile, the entire pile becomes the collection site and the subsamples are collected from various depths within the piles, as well as around the pile to obtain a representative sample. If the designer felt that the interior of the pile was significantly different in nutrient status or mycorrhizae, then the pile could be stratified into two collection sites—the exterior of the pile and the interior—and sampled separately. It may also be important to sample the subsoil because this will be the condition of the soil after construction and before mitigation.
- Collect a representative slice of soil—It is important to evenly sample the predetermined depth of soil. For example, if the sampling depth is 0 to 15 inches deep, then the entire section of soil must be equally sampled for each subsample.
- Mix subsamples—Subsamples for a sampling area are placed in a clean bucket and mixed thoroughly. From the composite subsamples, the required amount of soil is removed to send to the lab for analysis.
- Determine coarse fragment content—If the soils are high in coarse fragments, the samples can be sieved in the field. If the soils are dry, a 2mm sieve can be used. This will reduce the amount of soil to haul out of the survey area and also give an estimate of the coarse fragment content. Soils can be sieved back at the office prior to sending to the lab. If the samples are wet or moist, they will need to be air dried prior to sieving. The percent coarse fragment content is recorded, which includes large and small coarse fragments. This information will be used later to modify the lab results.
- Selecting a lab—The criteria for selecting a soil lab is typically based on costs, turnaround time, analytical tests, and consulting services. Most labs offer pH, nutrients, nitrogen, and organic matter tests for under $80 per sample (2016 prices) and deliver the results within two weeks of receiving the soil samples. For an added fee, laboratories will interpret the results of the analysis. While these are important reasons for selecting a lab, the primary criteria for selecting a lab should be based on the quality of the testing facilities.
A common assumption is that all labs are of similar quality in their analytical testing, and that if a group of labs were sent the same soil sample they would report similar results for most tests. This is not typically the case, as several university reviews of laboratories have shown (Neufeld and Davison 2000; Rose 2004). In one comparison, eight reputable laboratories reported widely differing results for all soil nutrients when sent identical soil samples (Rose 2004). One reason for the variation in results is that usually several testing procedures can be used to quantify a soil parameter. Some methods have greater accuracy and precision than others. The soil testing industry at this time has not settled on an agreed upon set of analytical methods to use. Even when the same tests are performed, labs often report different levels of accuracy (Rose 2004).
Soil laboratories can voluntarily participate in the North American Proficiency Testing (NAPT) program that will assess the quality of their analytical procedures. In this program, NAPT periodically sends all participating labs identical soil samples. Each lab analyzes the samples for mineral nutrients using established analytical procedures, then sends the results back to NAPT. The results from all labs are compiled and analyzed statistically and each lab is sent a report on how their results compared to the other participating labs. NAPT suggest that the accuracy be less than 10 percent of industry values and precision no greater than 15 percent of industry values (Neufeld and Davison 2000). These reports are not available to the public, but laboratories might share them if asked. NAPT is not a certification program but is often a basis for a soil lab quality control program.
The following is a checklist for selecting a high-quality lab (modified from Neufeld and Davison 2000):
- Does the lab have a quality control program? If they do, ask them to explain it.
- Does it participate in a proficiency testing program (such as NAPT)?
- Will they share the results of proficiency testing program?
- Does the lab use established analytical methods (the most appropriate for soils in the geographic area being tested)?
If a "no" is given for the answers to any of these questions, another soil testing facility should be considered. If the selection is between a couple of labs, consider sending duplicate soil samples with known properties ("checks") to each lab and compare the results using the NAPT suggested standards for accuracy and precision. Soil "checks" can be purchased through a proficiency testing program. Once a lab is selected, continue to ask for quality control reports. If the budget allows, periodically send duplicate "check" soil samples with regular soil samples to assess accuracy and precision.
Mitigating for Low Nutrients
Topsoil—Salvaging and reapplying topsoil are important for restoring nutrients to pre-construction levels, especially on sensitive soils (e.g., serpentine and granitic soils). The depth to apply topsoil should be at levels found in undisturbed reference sites or pre-construction soils, or can be calculated by methods described in Figure 5-27 in Section 5.2.4.
Compost—Incorporating composts is a good method for increasing nutrients to pre-disturbance levels. Determining which type of compost to select and how much to apply is discussed in Section 5.2.5.
Fertilizers—As discussed in Section 3.8.4, fertilizers should be used within an overall nutrient strategy. See Section 5.2.1 for a discussion on application methods, fertilizer types, timing, and other important aspects of fertilization.
Biosolids—Biosolids are rich in nutrients. If sources are available and transportation economical, this is a good way to add nutrients to disturbed sites (Figure 5-5).
pH
pH (potential of hydrogen) is the measurement of soil acidity or alkalinity based on a logarithmic scale of 0 to 14. Soils with pH values below 7 are acidic, and those above 7 are basic. Basic soils have high amounts of bases (positively charged ions), such as calcium, magnesium, potassium, sodium, and phosphates. Basic soils have developed under arid and semi-arid climates and are found throughout the Basin and Range, Colorado Plateau, and portions of the Great Plains. Acidic soils have formed in wetter climates, where the continued movement of water through the soil profile leaches bases from the soil. Acidic soils are common in the eastern United States, the coast range and mountains of the Pacific Northwest, and the Gulf states (Figure 3-45). Topsoils are typically more neutral when compared to underlying subsoil, whether the soils are acidic or basic. In some cases, the topsoil buffers the plant root systems from the underlying, inhospitable subsoil conditions. When topsoils are removed during construction, subsoils become the growing environment and, unless mitigating measures are taken, plant establishment and productivity of the site is greatly reduced.
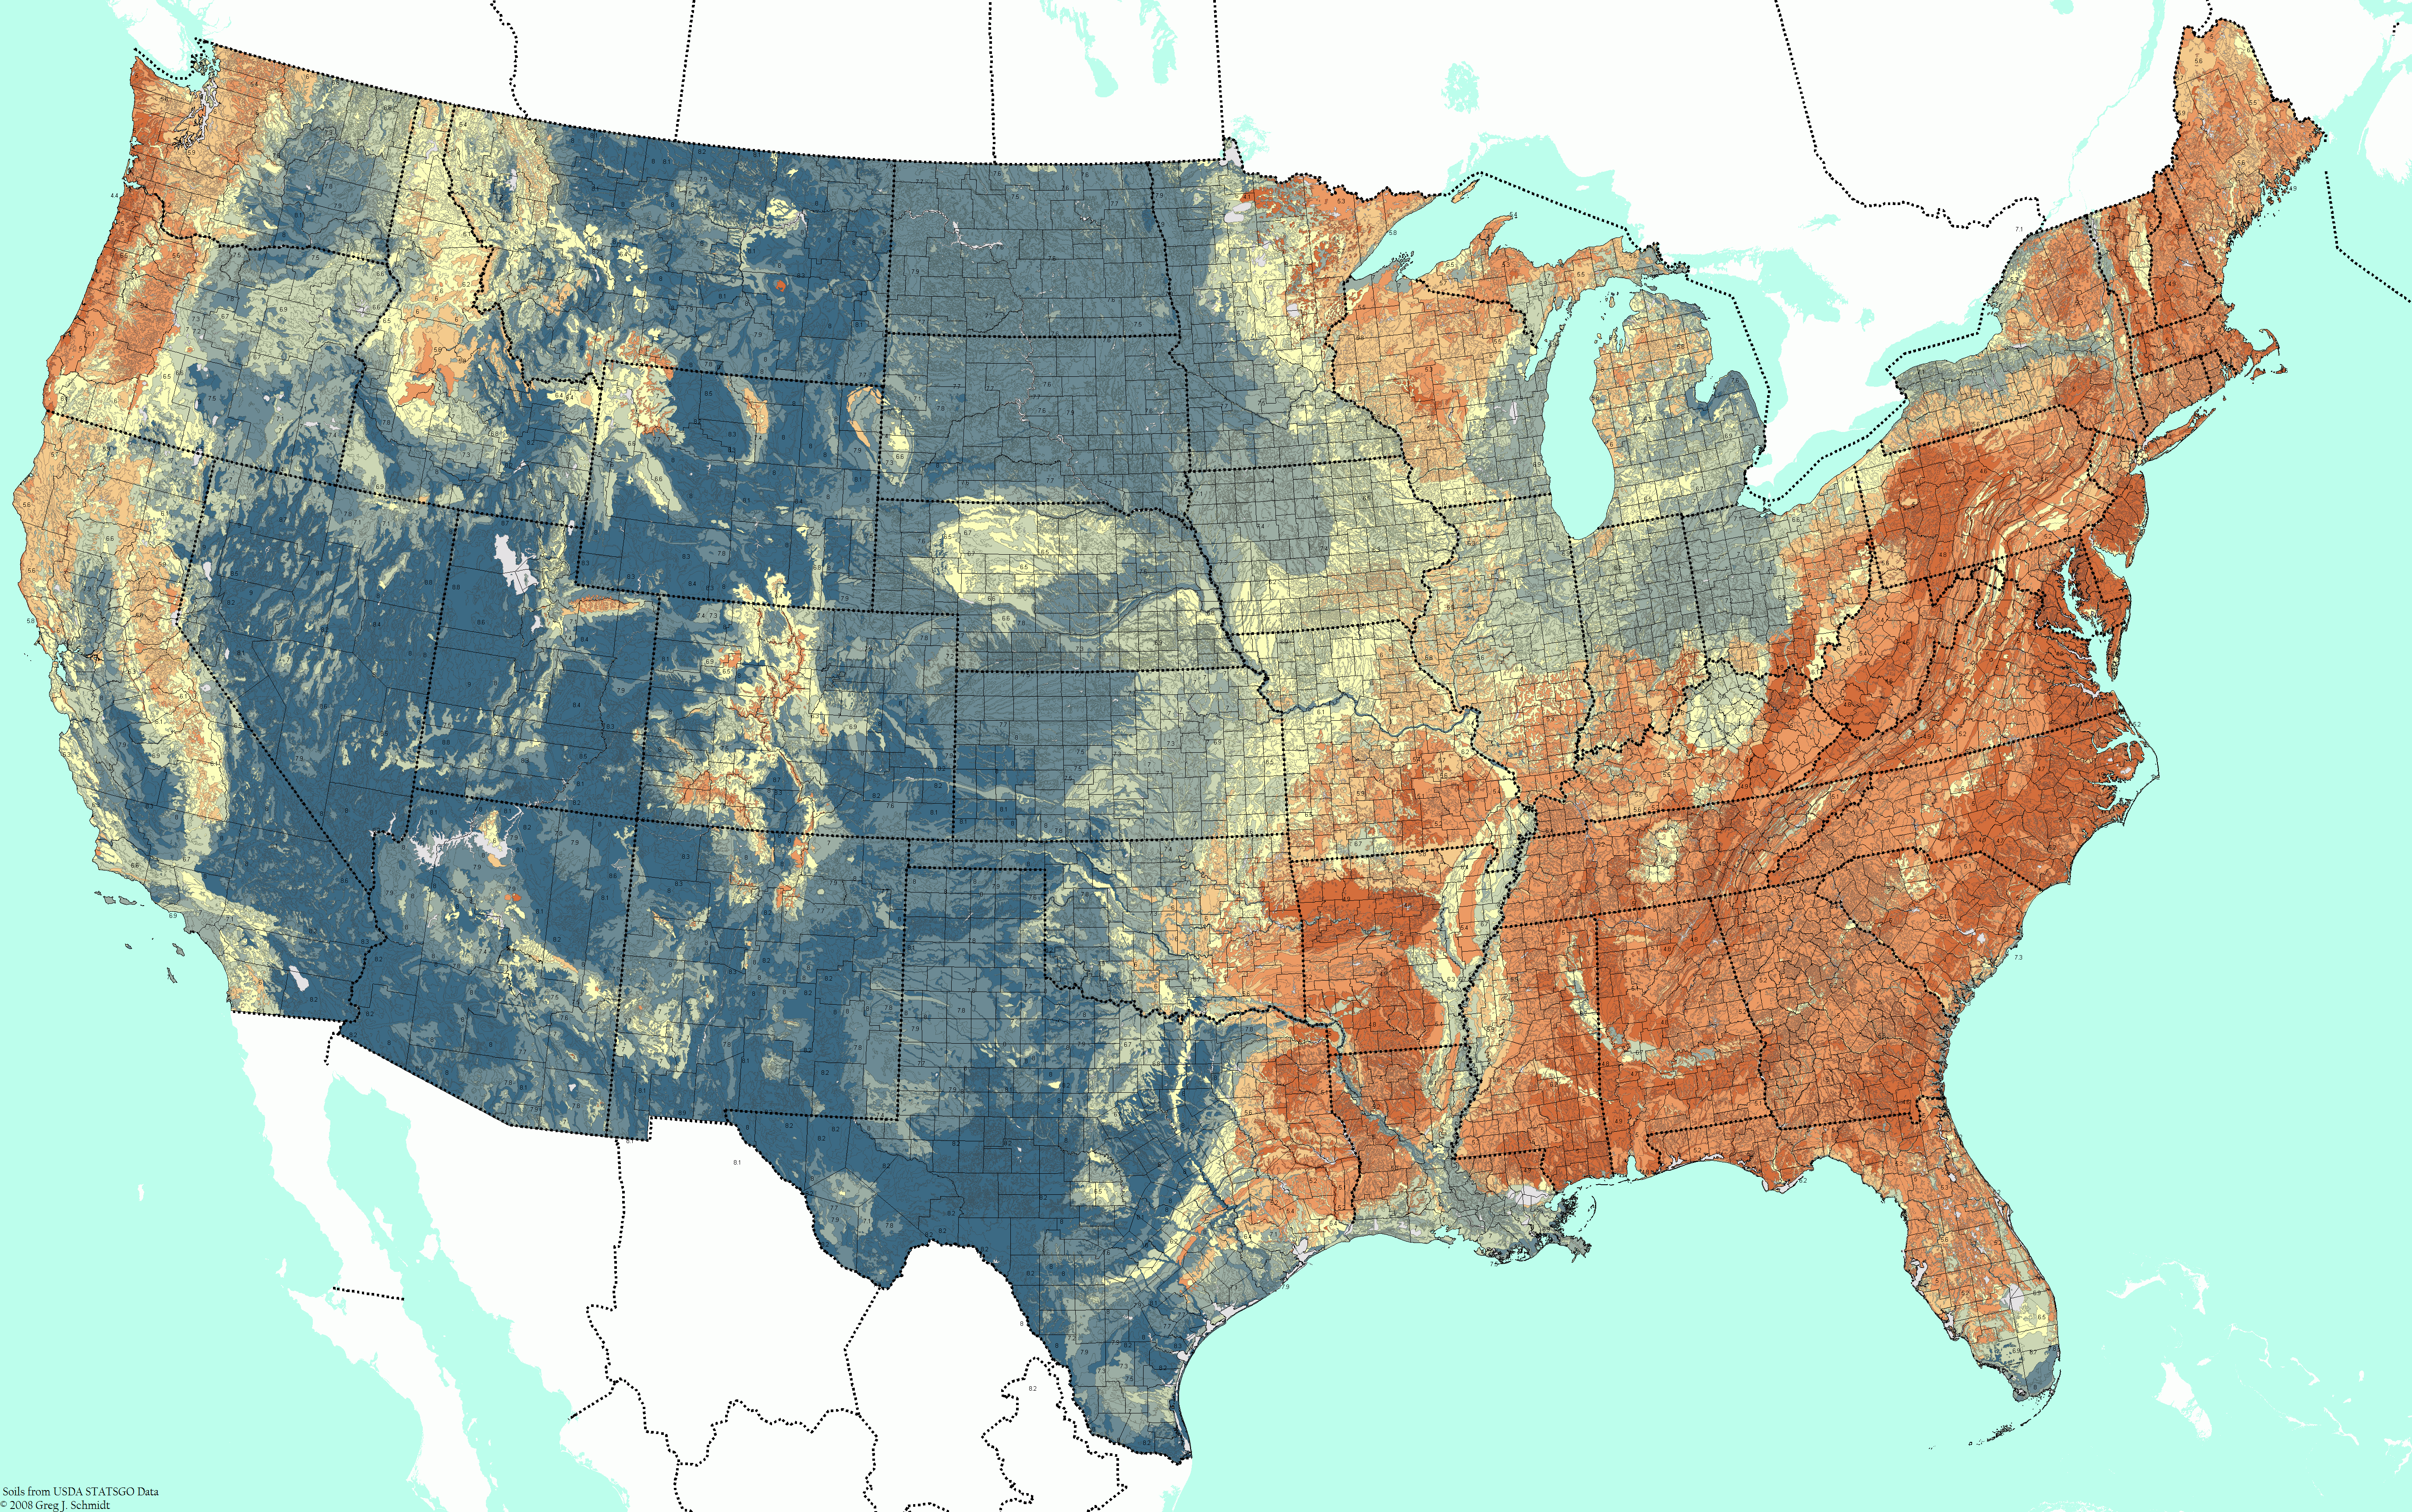
Figure 3-45 | Soil pH levels across the US
The soils of the United States have a range of soil pH values, from less than 5.0 to greater than 8.0. Basic (high pH) soils shown in blue are widespread in areas of the United States that receive low rainfall. Acidic soils (low pH) shown in red occur in areas of very old soils common in the eastern United States or in areas of high rainfall common to the Pacific Northwest.
Source: Bonap.org
Soil acidity and alkalinity affects mineral nutrient availability, mineral toxicity (Palmer 1990), and nitrogen fixation (Thorup 1984). In acid soils, the ability of plants to utilize many nutrients decreases, especially for calcium and magnesium. As soil pH becomes more acid (less than 4.5), aluminum becomes more soluble and more toxic to plant growth. Low pH soils also hinder the establishment of nitrogen-fixing plants, such as legumes (Bloomfield and others 1982). Significant loss of rhizobia viability has been documented at pH levels less than 6 (Brown and others 1982).
Soil with pH values of 8.0 or greater indicate the presence of calcium carbonate (Thomas 1967). Calcium and magnesium are at such high levels that they interfere with the uptake of other nutrients, notably phosphorus, iron, boron, copper, and zinc (Campbell and others 1980). High pH soils typically have high salt levels, which can also restrict the growth of many plants. For example, as soil pH approaches 9.0, sodium concentrations become toxic to plants (Tisdale and Nelson 1975).
How to Assess pH—The pH test is a standard analytical measurement that is typically run on soil samples sent for nutrient analysis. The pH test is also conducted on soil organic matter amendments considered for mulch or incorporation into the soil. The pH test is accurate, with values differing between laboratories by 0.1 to 0.2 points (Thomas 1967). pH can also be tested by the practitioner on site or back at the office using reasonably priced equipment. Most portable pH meters can measure soluble salts and this dual capacity is important in areas with high salts (Section 3.8.4, see pH). It is important when selecting a pH meter that has a tip that can be submerged easily in a soil slurry.
The most accurate method of assessing pH is through lab analysis. However, quick, reliable estimates can be made with a hand-held pH/electrical conductivity meter using the Saturated Media Extract (SME) method for preparing samples (Figure 3-46). This method requires a small amount of soil (50 cc) be placed in a jar. Just enough distilled water is stirred into the soil to make the surface "glisten" but not readily flow. After the mixture rests for approximately 15 minutes the pH probe is inserted into the soil so that the sensors are completely covered and the pH reading is made.
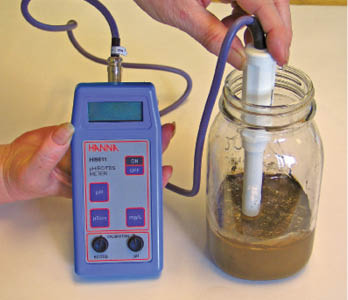
Figure 3-46 | pH meter
Most portable pH meters will also measure salts (electrical conductivity). Many probes can be directly inserted into the saturated media.
Photo credit: David Steinfeld
Mitigating for Low pH Soils
Apply Liming Materials—Raising the pH through the application of liming materials is a common agricultural practice that can be applied to revegetating road sites (Section 5.2.6).
Apply Appropriate Fertilizers—Some commercial fertilizers, especially ammonium-based fertilizers such as ammonium nitrate, ammonium sulfate, and ammonium phosphate, will reduce pH (Havlin and others 1999) and should be limited on acidic soils. Fertilizers that have calcium, magnesium, or potassium in the formula are more appropriate for low pH soils. Examples of these fertilizers are calcium nitrate, potassium nitrate, and magnesium sulfate.
Apply Lime with Organic Matter—Incorporation of organic matter will lower pH. On acid soils, application of lime with organic matter will raise the pH of the soil (Section 5.2.6).
Apply Topsoil—Where topsoils have been removed leaving very basic or very acidic subsoils, reapplying topsoil or manufactured topsoil can moderate pH levels.
Mitigating for High pH Soils
Apply Organic Matter—Incorporated composts or other types of organic matter can lower soil pH as the organic matter decomposes (Havlin and others 1999). For arid sites, however, the pH and conductivity of the organic matter must be tested prior to purchase to avoid the possibility of introducing organic matter high in salts.
Add Nutrients—To compensate for the tie-up of certain nutrients, the addition of nutrients through fertilization may be considered, however, the benefits of using fertilizers on arid soil must be offset by the possibility of creating fertilizer salt problems.
Apply Sulfur—Agricultural soils can be treated with sulfur to lower pH, but high quantities of sulfur and irrigation must be applied to lower the pH just slightly (Havlin and others 1999). The use of sulfur in roadside revegetation therefore is not a widely practiced method.
Irrigation
Applying irrigation water is another method of reducing soil pH by leaching out bases. However, the amount of water needed to lower pH levels can be very high; in most cases, using irrigation is not a viable mitigating measure on roadsides. It is also difficult to find irrigation water in arid environments that is low in bases and salts. Applying irrigation water that is high in bases will raise pH and salt levels in the soil, compounding the problem.
Salts
Soil salinity is the measure of the total amount of soluble salts in a soil. The term soluble salts refers to the inorganic soil constituents, or ions, that are dissolved in the soil water. The principal soluble salts in most soils contain the cations—sodium, calcium, and magnesium, and the anions chloride, sulfate, and bicarbonate (Landis and Steinfeld 1990).
Almost all plants are susceptible to salt injury under certain conditions, with germinants and young seedlings being particularly susceptible to high salt levels (Figure 3-47). Soluble salts can injure plants in several ways:
- Reduced soil moisture—Salts can lower the free energy of water molecules, causing an osmotic effect and thereby reducing the moisture availability to plants.
- Reduced soil permeability—High salt concentrations (specifically sodium salts) can change the soil structure by reducing the attraction of soil particles, causing them to disperse. Pore space is lost and air and water movement within the soil profile are restricted.
- Direct toxicity—High levels of certain ions, including sodium, chloride, and boron, can injure plant tissue directly.
- Altering nutrient availability—Certain nutrients as salts can change the availability and utilization of other plant nutrients (Landis 1981; Landis and Steinfeld 1990).
Figure 3-47 | Soluble salt effects on plants
Soluble salts will injure germinants and, at higher concentrations, damage established plants. Values are based on the saturated media extract method of conductivity measurement reported in mS/cm (microSiemens per centimeter).
Modified from Fisher and Argo 2005
High salt levels are common in arid regions of the United States where there is inadequate precipitation to leach salts out of the plant root zone (Figure 3-48). As a result, salts move out of the topsoil and accumulate in the subsoil. At high enough concentrations, a layer of calcium carbonates form, creating an impermeable horizon call caliche. This layer restricts root growth and soil drainage. When topsoil is removed, the resulting surface soils may be very high in salts or where a caliche horizon is present, may expose a hardened calcium carbonate surface. High salt concentrations can also be created by poor soil drainage resulting from compaction; when excessive amounts of fertilizer, manure, or compost are applied; or when de-icing chemicals applied to roads run off and enter the soil (Parent and Koenig 2003).
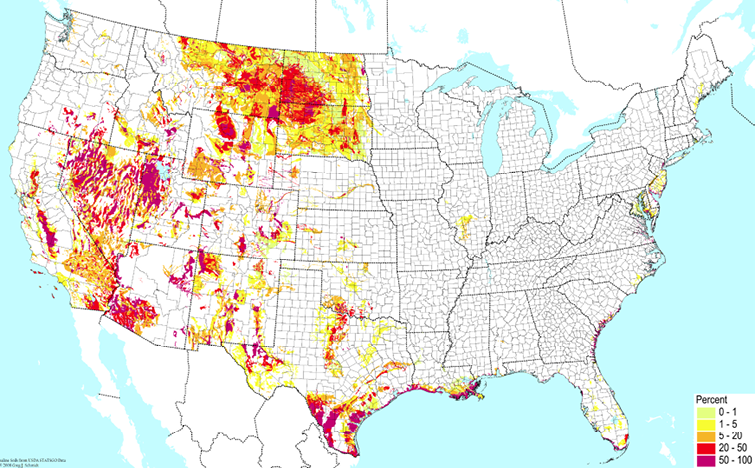
Figure 3-48 | Soils with high salts
Soils with naturally high salt content typically occur in regions of the United States with low annual precipitation.
Source: Bonap.org
Deicing salts can pose a problem to plant establishment depending on the annual quantity of salt applied, distance from the road, type of salt applied, annual precipitation, and soil type (Section 3.11.9, see Deicing for Winter Safety). The sensitivity of a plant species is also important and it may be necessary to revegetate with plant species that are less sensitive to salts. These can be selected using the ERA tool.
How to Assess Salts—There are two methods of measuring salts: Electrical Conductivity (EC) and Total Dissolved Salts (TDS).
EC is a relatively easy test to run and is the most commonly used test in nurseries, forestry, and agriculture. Most pH meters are equipped to measure EC. Electrical conductivity measures how strongly electrical current flows between two metal plates. The more dissolved salts there are in solution, the greater the current and higher the electrical conductivity. EC is reported as the conductance over the distance between plates. The standard unit of measure is microSiemens per centimeter (μS/cm), though there are many ways that it can be expressed which can be confusing. To convert these units to μS/cm:
- µS/cm = 0.001 dS/m
- µS/cm = 0.001 mS/cm
- µS/cm = 0.1 mS/m
- µS/cm = 0.001 mmho/cm
- µS/cm = 1 µhos/cm
The most accurate method of assessing salinity is through lab analysis, however, quick estimates can be made with a hand-held pH/electrical conductivity meter using the Saturated Media Extract (SME) method for preparing samples as described in Section 3.8.4, see pH. Landis and Dumroese (2006) provide a more detailed discussion on EC and measuring methods.
The second method of measuring salinity is the TDS. In this method, a known sample (water or soil solution) is evaporated and the remaining salt is weighed. This test is more difficult to run but it is often used in reporting salinity levels in road deicing studies. Test values are reported in milligrams per liter of water (mg/l) which is equivalent to parts per million (ppm). To convert TDS values to EC:
EC ( µS / cm ) = TDS ( mg / L ) / 0.6
Mitigating for Salts
Because high levels of soluble salts are often caused by poor soil management, the key to mitigating high salinity is to avoid creating the conditions that could cause those levels. In soils where internal drainage is poor, prevention may be the only feasible approach for reducing salt problems. Reducing the quantity of road deicing salts can also lower the amount of salts that enter the soil.
Avoid Mulch or Soil Amendments with High Salinity—Testing all materials to be applied to the site will aid in the prevention of increased salt levels in the soil. Amendment materials with electrical conductivity readings more than 1 µS/cm should be avoided.
Reduce Commercial Fertilizers—Some commercial fertilizers, such as control-release fertilizers (CRF), can significantly increase the soluble salts found in the soil. This can be a major problem when using CRF in arid conditions. The fertilizer will begin to release following wet, warm spring conditions, but will not be leached through the soil without significant rainfall through the summer. Salts can build up to damaging levels, both on the surface and in the plant root zone.
Apply Gypsum with Irrigation—Incorporation of gypsum (calcium sulfate) followed by leaching can be effective in situations where sodium is the cause of high soluble salts (e.g., de-icing materials have been applied to roads). The calcium in gypsum will displace sodium, and the sodium will then leach out of the soil profile with irrigation or rainfall (UMES 2004).
Irrigation—Application of irrigation water if often used to leach salts from the soil. The amount of water depends on the soil type. In arid soils, application of 6 inches of water can reduce salinity levels by 50 percent; 12 inches can reduce salinity levels by 80 percent; and 24 inches can reduce salinity levels by 90 percent (UMES 2004). However, for most sites roadside project, this is not practical due to high costs.
Select salt resistant plant species—If salts are present or are expected to be present through deicing practices, selecting species from the ERA that are less sensitive to the effects of salts may improve revegetation.
3.8.5 Surface Stability
Surface stability is the tendency of the soil to remain in place under the erosive forces of rain, wind, and gravity. Good surface stability is essential for establishing plants, reducing erosion, and maintaining high water and air quality. When seeds are applied to unstable surfaces, they often move off the site through water or wind erosion leaving the site barren of vegetation. Soil is also removed in this process, which reduces the productivity of the site. Excessive erosion also affects the survival of planted seedlings by removing soil and exposing roots.
Site factors that influence surface stability and soil erosion are as follows:
- Rainfall
- Wind
- Freeze-thaw
- Soil cover
- Surface strength
- Infiltration rates
- Slope gradients
- Surface roughness
- Slope lengths
All surface erosional processes start first with the detachment of soil through the forces of rainfall, wind, or frost heave. These forces loosen seeds and soil, making them more susceptible to movement off the site. Surface runoff, during rainstorm events, is the primary factor in moving seeds and soil into stream channels, resulting in lost seeds and water quality problems. This occurs when infiltration rates (the rate water moves through the soil surface) are lower than rainfall rates. If slope gradients are steep, slope lengths are long, or surface roughness is low, surface water picks up energy and transports greater amounts of soil and seeds downslope. As this energy increases, water becomes concentrated with enough force to cut through the surface of the soil, creating rills and gullies. The degree to which soils detach is directly related to the percentage of soil cover protecting the soil (more cover, less erosion) and to the soil strength, or the capacity for individual soil particles to hold together under erosional forces. The result of soil erosion can often be detected on road cuts by noting how much sediment is in the ditch line. If the ditch is full of recently deposited sediment (recently deposited sediment usually lacks vegetation), there is a good chance that sediment came from the cut slope. An inspection of the surface of the cut slope will indicate if the sediment originated there. Gravels, cobbles, and even small plants will show the results of soil movement (see Figure 3-52, Figure 3-54, and Figure 3-55).
Rainfall
Each project site has a unique rainfall pattern that will affect the stability of the soil surface. Periods of high rainfall intensities can move seeds and soil particles off-site through erosional processes which begins with the raindrop. Raindrops have been likened to small bombs. In heavy rainstorms, they fall with such speed (up to 20 miles per hour) that, when they hit the soil surface, they create an impact that can blast the soil or seeds several feet away and leave behind small craters. After such events, the soils surface is compacted and sealed with fine soil particles that can significantly reduce surface infiltration rates.
The intensity of a rainfall event determines how much soil is detached. A high intensity rainfall will detach more soil particles than a low intensity rainfall. But detachment is only one aspect of erosion; it takes surface runoff to move soil and seeds downslope. If an intense rainstorm lasts only a short period, there may be insufficient water to exceed infiltration rates and water will absorb into the soil. If the duration is long, some water will not enter the soil, and run over the surface as overland flow, carrying soil and seeds downslope. The most critical weather events are those that bring high intensity rainstorms of long duration. High intensity rainfall is common in the central and eastern United States, whereas in the western U.S., high intensity storm events are less frequent and typically occur during summer thunderstorms or major winter storm systems (Figure 3-49). Precipitation in the form of snow is not typically a problem for surface erosion because snow cover protects the soil surface from rainfall splash and water from snowmelt usually occurs at such slow rates that even soils with low infiltration can absorb it, reducing the likelihood of runoff.
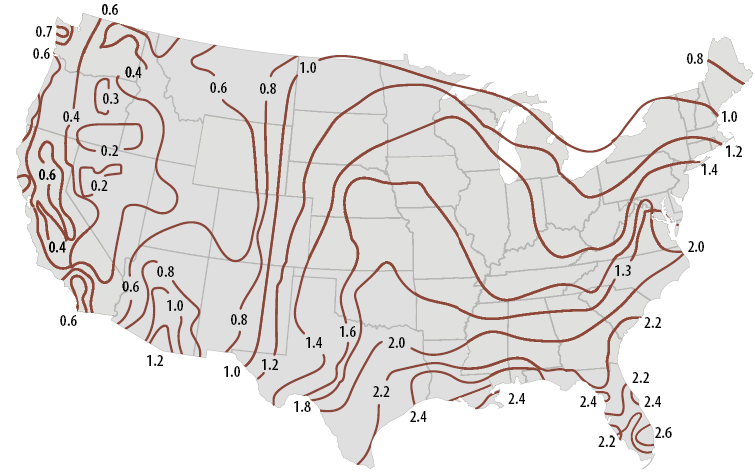
Figure 3-49 | Rainfall intensities across the US
Rainfall intensities increase moving from western to eastern United States. The differences in intensities can be dramatic, ranging from 0.2 inches/hour in Nevada to 2.6 inches/hour in Florida for a 2-year, 1-hour storm event.
How to Assess Rainfall—It is unlikely that climate reports or weather records will give the duration and intensities of rainfall events for site level planning. Digital rainfall gauges are available that record the amount of rainfall and the time it occurred. This information is used to determine duration and intensity. While the cost of this equipment is high, it is becoming more affordable. Many types of digital rain gauges are available, ranging in price and quality. It is important to select a digital rain gauge that is rugged, self-maintaining, and can record for long periods of time. Some systems upload weather data to the internet where it can be accessed remotely through smart phones and computers for data summary and analysis.
Mitigating for High Rainfall
Minimize Disturbance—In areas of high rainfall or sites where water quality values are high (near streams or rivers), the best engineering design is to keep the footprint of the construction project disturbance to a minimum. Not only does this reduce the risk of delivering sediment to the aquatic system, it can reduce project costs by reducing the amount of area needing revegetation.
Integrate Erosion Practices—On disturbed sites, especially those near streams, the integration of erosion practices with plant establishment techniques offers the best approach to stabilizing the soil surface. These include practices such as increasing soil cover, shortening slopes, reducing slope gradients, leaving roughened surfaces, reducing compaction, increasing infiltration rates, and quickly establishing native vegetative cover.
Use Appropriate Mulching Practices—Applying a surface mulch is one of the best practices for controlling surface erosion because it protects the soil surface from rainfall impact and reduces overland flow. The types of mulches are described in Section 5.2.3.
Wind
Wind erosion can be a major limiting factor in establishing native plants (Figure 3-50), especially in the Great Plains and portions of the Eastern Temperature Forests ecoregions (Figure 3-51). Wind erosion begins with a process called saltation in which a soil particle is lifted by the wind and bounced along the ground surface, dislodging other soil particles in its path. The resulting dislodged particles either become airborne or continue to roll or hop along the surface of the soil, dislodging more particles. Saltation occurs with very fine to medium sands, ranging from 0.003 to .04 inches (.07 to 1 mm). Particle sizes smaller than that (silts and clays) become airborne and can be carried long distances (Fifield 2004).
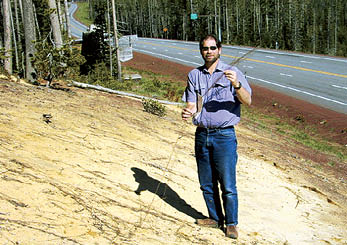
Figure 3-50 | Wind erosion removes topsoil and exposes roots
Wind erosion not only blows seeds, soil, and mulches off the soil surface, it will also expose roots of established plants, as shown in this photograph. Non-cohesive soils, like sands and silts, are most prone to wind erosion.
Photo credit: David Steinfeld
Wind erosion affects revegetation in several ways. Newly sown seeds and seed cover can be removed in high winds, resulting in poor germination and plant establishment. Plants that do establish, can be damaged through saltation, where dislodged soil particles continually abrade the plant stems. In extreme conditions, topsoil is removed, reducing the soil productivity and plant growth. This is more severe where topsoils are thin. Where plants are established, loss of topsoil can also expose roots, causing reduced growth and in some cases, mortality.
How to Assess Wind—Permanent wind speed equipment is available but is most likely beyond the reach of most project budgets. Site visits during different times of the year provide some indication if wind is a problem. Site characteristics, such as position on slope (ridgelines are more prone to high winds than a valley floor) or proximity to forested environments (forests often reduce wind speeds). Observing soil surfaces for signs of erosion can be helpful and include appearance of bare soils, exposed roots, and fine soils deposited behind stable structures. Local residents may also provide some information on local weather events.
Figure 3-51 | Areas in the United States that have high winds
High winds are the primary cause of soil erosion in many areas of the United States. This map shows areas where wind erosion could strongly influence the establishment of native plants (areas in red) (FHWA 1992). The effects of wind on revegetation are very site specific, the potential of which can be determined during field surveys.
Assessing risk of wind erosion can be determined by:
- Wind speed—The rate of soil movement is proportional to wind velocity. Wind speeds are considered erosive when they exceed 13 miles per hour measured 1 foot above the soil surface for loose sands (Lyles and Krauss 1971).
- Soil Texture—Silt contents have the most potential to be dislodged and become airborne. Clays can be susceptible when soils have been continually disturbed and clods have been destroyed. Sandy texture soils are less susceptible to becoming airborne but will move through surface creep and saltation.
- Rock fraction—The amount of rock fragments in a soil affects the severity of wind erosion; the more rock, the greater the protection of the soil surface. In addition, surface rocks may also collect windblown silts and sands over time, increasing soil depth.
- Organic matter—Soils that are higher in soil organic matter, especially organic cements that produce stable aggregates, have greater stability.
- Water content—water holds soil grains together through cohesion so when surface soils have a high moisture content, they have greater strength.
- Surface roughness—a roughened soil surface composed of a microtopography of ridges and valleys will trap and suspend soil particles, especially if the ridges are predominantly perpendicular to the direction of the wind.
- Vegetative cover—The height and density of vegetation affects the air flow on the surface of the soil; the greater the height and density the lower the wind velocity. Windbreaks, such as shelterbelts, can significantly reduce wind velocities (see Inset 3-3).
- Soil cover—Soils that are covered with a stable material are more resistant to wind erosion.
Mitigating for High Wind
Maintain vegetative cover—Keeping the construction footprint to a minimum is one of the best practices for controlling wind erosion. Minimizing the width of the disturbances perpendicular to the direction of the prevailing winds will also reduce the effects of strong winds.
Install shelterbelts—A shelterbelt is a line of trees that reduce the wind velocity and reduce the potential for wind erosion (Inset 3-3). The ERA tool can be consulted for appropriate trees and shrubs suitable for shelterbelts, depending on the ecoregion.
Create microtopography of ridges and furrows—When the soil surface is left in a roughened condition of ridges and furrows, wind erosion can be reduced significantly, however the effectiveness depends on the stability of the soil (Fryrear and Skidmore 1985). Ridges formed in non-cohesive soils or soils that do not form clods when tilled, will have a short life span.
Tillage, using a land imprinter (Section 5.2.2, see Roughen Soil Surfaces), may be a good alternative to loosening soils with traditional tillage equipment (e.g. disks, harrows) because imprinting compresses the soil while it forms depressions, thereby creating a roughened surface and increasing soil strength that will increase resistance to wind erosion (Dixon and Simanton 1977).
Mulch—Applying a mulch is one of the best practices for controlling surface erosion (Section 5.2.3), however, mulches be removed with strong winds. Some materials, such as wood strand mulches (Section 5.2.3, see Wood Strands and Wood Wool), have been tested under high wind conditions and, because of higher weights and interlocking particles, may be more resistant to high winds.
Lighter mulch materials, such as straw and hay, are more susceptible to wind erosion and must be crimped into the soil to keep them in place. Hydromulch with tackifier or just tackifier applied with hydroseeding equipment can be effective in stabilizing hay mulches in areas with lower wind speeds.
Place Large Woody Material—Downed woody material, such as trees and large branches, can be used to block the soil surface from wind and rainfall.
Inset 3-3 | Wind breaks—shelterbelts and living snow fences
Shelterbelts. A shelterbelt is a vegetative barrier that reduces wind speeds, resulting in lower soil erosion. Shelterbelts also provide excellent pollinator and wildlife habitat. Shelterbelts work by creating wind resistance in the face of the prevailing wind. The reduction in wind velocity can be significant depending on the height of the shelterbelt. Depending on the wind speed, the effect on the leeward side of the shelterbelt (the side away from the wind), can be up 10 to times the height of the shelterbelt and on the windward side (the side toward the wind), as much as 5 times the height (see illustration below).
For greatest effectiveness, shelterbelts are designed perpendicular to the direction of the prevailing winds. Shelterbelts with multiple rows of vegetation have a greater reduction in wind speeds than single row shelterbelts because there is more vegetation to block wind flow. A two-row shelterbelt composed of shrubs and trees not only provides more wind resistance, it provides better wildlife and pollinator habitat. The effectiveness of a windbreak depends on the selection of tree and shrub species and planting density. It is important to understanding wind speeds, shelterbelt effectiveness, and appropriate species specific for the project area to develop an appropriate shelterbelt design.
Wind speeds can be reduced on the leeward side of a shelterbelt by 25 to 60 percent within a distance that is 10 times the height of the shelterbelt. It also can reduce wind speeds on the windward side by 25 to 80 percent within a distance 5 times the height on the windward side. In the example shown below, a 10-foot-high shelterbelt reduces the wind velocity significantly 50 feet before the shelterbelt and 100 feet beyond the shelterbelt (modified from Casement and Timmermans 2007).
Living Snow Fence. When vegetation is installed for snow management, it is referred to as living snow fences. Densely planted trees and shrubs along highways can reduce the amount of snow drift on roadways and subsequently, lower winter maintenance costs. These living snow fences create a barrier which reduces wind speeds and drops snow in front of and downwind of the break. Designing an effective living snow fence requires an understanding of the wind speed, wind direction, and annual snowfall. Some of this information can be obtained from historic climate data from local weather stations (Section 3.3.1) but in most cases, it can be obtained from local maintenance personnel. Visiting existing snow fences during the winter can help in designing living snow fences. The most effective living snow fence is planted perpendicular to the prevailing wind direction at a minimum of 175 feet from the road centerline (South Dakota Department of Agriculture (2006). Other States and municipalities may have guidance on the design of natural or man-made snow fencing for their area. Shrub and tree species that grow at least 6 to 8 feet tall are good for living snow fences. Optimum snow storage capacity is achieved when individual rows have a density of 50 to 60 percent cover as viewed through the winter vegetation. Density is determined by how closely plants are spaced and whether the vegetation is deciduous or evergreen. When vegetation densities are low, more snow moves through the living snow fence while snow fences with high densities run the risk of being damaged by deep snow drifts (Brandle and Nickerson accessed 2017). The most effective living snow fences are those with at least two rows of shrubs or trees.
Freeze-Thaw
Freeze-thaw is the process of ice formation and ice melting that occurs in a 24-hour cycle within the surface of the soil. At night, temperatures drop at the soil surface and water begins to freeze within the soil pores, creating ice crystals. As ice crystals continue to form, water is drawn from the soil below through capillary action to replace the water that created the ice crystals. During freezing, ice crystals expand in the soil and push soil aggregates apart (Ferrick and Gatto 2004), weakening the internal structure of the soil. When soils thaw the following day, soil strength is greatly reduced (Gatto and others 2004), leaving the soil surface significantly less resistant to erosional forces. Freeze-thaw is considered one of the least understood aspects of soil erosion (Ferrick and Gatto 2004) and yet accounts for significant annual soil losses (Froese and others 1999).
The formation of ice crystals will destabilize the seed germination environment. Freeze-thaw cycles affect germinating seeds by creating ice crystals that physically push the new seedlings above the soil surface, exposing the emerging roots to extremely harsh conditions for seedling establishment, including low humidity, high temperatures, and sunlight. On steeper slopes, soil particles and germinating seeds move downslope after each freeze-thaw cycle, further destabilizing the seed germination environment. Freeze-thaw processes can also affect seedling establishment. Long periods of freeze-thaw cycles can push seedlings out of the ground, exposing roots and, in many cases, killing seedlings (Figure 3-52).
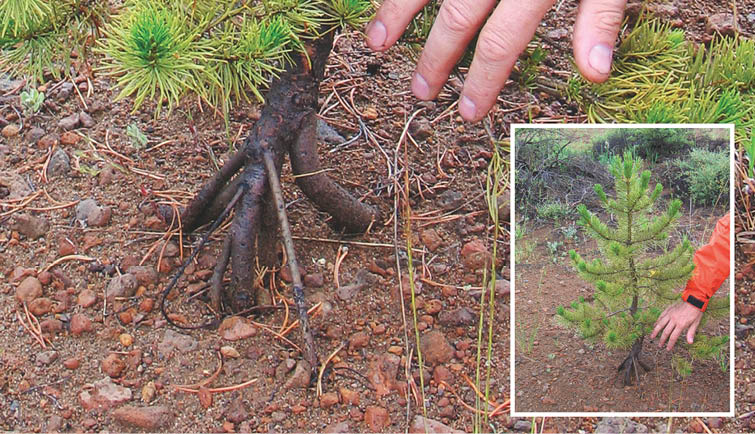
Figure 3-52 | Freeze-thaw effects on planted seedlings
Continual freeze-thaw conditions can push root systems of planted seedlings out of the ground, reducing growth and potentially killing seedlings.
Photo credit: David Steinfeld
Soils most susceptible to freeze-thaw effects are those with a high silt content or soils that are compacted. Soils are most susceptible when they are cold and wet. Silt-sized particles have pore sizes that are small enough to pull moisture to the layers that are freezing through capillary action, yet large enough to form ice crystals (Ballard 1981). Sandy soils do not draw moisture to the freezing layer because the pores are too big. Clays, on the other hand, have good capillary characteristics, yet do not have large enough pores for ice crystals to form (Ferrick and Gatto 2004). Sands are susceptible to freeze-thaw when they are compacted because the size of the pores is reduced, encouraging capillary rise (Gatto and others 2004). Soil cover, which includes litter, duff, and organic mulches, does not typically have good capillary rise characteristics, and therefore are less frost-susceptible. In addition, soil cover offers good thermal protection, which moderates the degree of freezing and thawing at the soil surface. The effects of freeze-thaw on surface stability increases as slope gradients steepen; the steeper the slopes, the greater the movement of seeds and soil downslope each day. For example, a seed or soil particle on a steep slope rises 2 inches on top of an ice crystal (Figure 3-53) but when the crystal melts, the seed or soil particle drops to a different point farther downslope. After many freeze-thaw cycles, the distance traveled by the seed or soil particle can be significant.
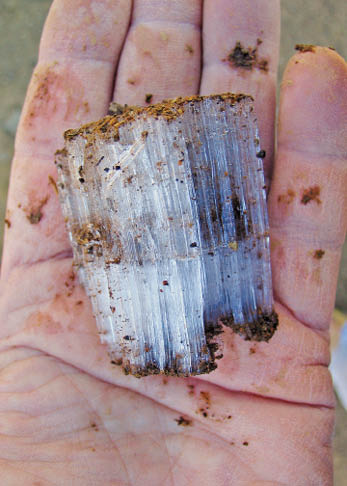
Figure 3-53 | Freeze-thaw ice crystals
Ice crystals that form under freeze-thaw conditions can lift soil particles over 2 inches above the original surface. Later in the day the crystals will melt and the particles will drop.
Photo credit: David Steinfeld
How to Assess Freeze-Thaw—Freeze-thaw processes typically occur in the spring and fall, when soil moisture levels are high and soil temperatures are cold. Soil surfaces that have undergone freeze-thaw cycles will have a very loose crust that will collapse when touched or walked upon. Gravels are often perched on pedestals, but give way under light pressure.
Project areas with bare surface soils high in silts or compacted sands should be considered prone to freeze-thaw processes, while soils with deep mulch or litter layers are less susceptible.
Mitigating for Freeze-Thaw
Apply Mulch—Available research on the mitigation of freeze-thaw effects is slim, but it can be assumed that practices, such as applying an organic mulch, will insulate the soil surface and minimize the effects of freeze-thaw. The deeper the mulch layer, the less propensity for freeze-thaw at the surface. Hydromulch applications at typical rates of 1,000 to 2,000 lb/ac are too thin to moderate surface temperatures or strong enough to resist the destabilizing effects of ice crystal formation on surface strength. Deep application of most mulches however, will bury seeds, resulting in poor seedling emergence. An alternative to is to apply needles or wood strands because these materials can be applied at greater depths and still allow light through for seedling emergence. For planted seedlings, the application of very deep mulches will reduce the effects of freeze-thaw. Gravels, cobbles, and stone can provide a stable soil cover. These materials are often left over after rock has been screen from the soil and designed into the slope can add surface stability and reduce evaporation.
Till Compacted Soils—Sandy soils are very susceptible to freeze-thaw if they are compacted. Loosening soils through tillage is perhaps the best method of mitigating the effects of freeze-thaw on these soil textures (Section 5.2.2).
Avoid Wet Soils—Planting or sowing in soils with high water tables and poorly draining soils should be avoided. The extra moisture in these soils will continue to supply water for ice crystal formation. Planted seedlings can be pushed out of the soil in these environments (Figure 3-54).
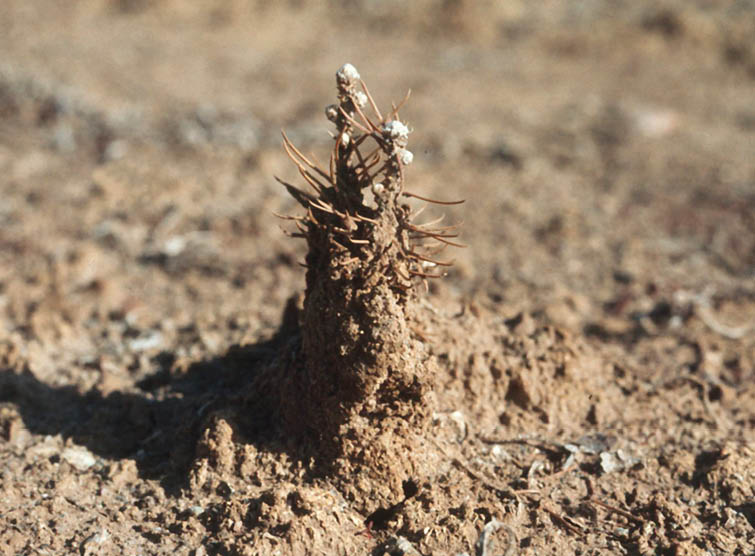
Figure 3-54 | Soil erosion affects seed germination
Soil cover protects the surface from rainfall impact. Not only is soil removed during rainstorms, affecting germination and seedling establishment, but seedlings that do emerge can be covered with soil that splashes from rainfall impact. Seedlings will not grow through an encasement of soil.
Photo credit: Thomas D. Landis
Maintain Some Overstory Canopy—Trees and shrubs will moderate surrounding temperatures, reducing the potential for freeze-thaw.
Soil Cover
Soil cover is the layer directly above the surface of the soil. In an undisturbed environment, soil cover is composed of a combination of duff, litter, live plants, and rock. Soil cover is very important for surface stability because it dissipates energy from rain drop impact, protecting the soil from high intensity rainfall events. Furthermore, soil cover will slow the movement of runoff and capture sediments and seeds, preventing them from moving downslope. Section 3.8.3 discusses how soil cover is important for reducing evaporation; this section will discuss its role in stabilizing the soil surface and reducing erosion.
When the soil surface lacks cover, it is subject to the direct forces of raindrop impact, overland flow, wind, and gravity. These forces not only move soil offsite, affecting water and air quality, but they also displace seeds or remove soil from around newly developing seedlings (Figure 3-54). A lack of soil cover will impact revegetation objectives by reducing the quantity of seeds that will germinate. Seedlings that do emerge will be negatively affected by soil splash and sheet erosion that remove soil from around the seedling roots. The severity of soil erosion and seed movement is directly related to the percentage of bare soil.
After construction, most organic soil cover is removed. What remains is bare soil and coarse fragments (gravel, cobble, and stone). Left unprotected, bare soil will erode during rainstorms, leaving a pavement of coarse fragments (Figure 3-55) If the amount of coarse fragments in the soil is high, then the percentage of the soil surface covered by coarse fragments will also be high. By the third year, erosion rates on unprotected bare soils typically fall to a tenth of the rate of the first-year rate because of the formation of a coarse fragment surface (Megahan 1974; Ketcheson and others 1999). While this process produces less sedimentation to stream systems, the high coarse fragments at the soil surface are a poor environment for seed germination. For this reason, it is important to quickly stabilize the soil surface after soil exposure and why most road contracts call for temporary road stabilization during the construction period.
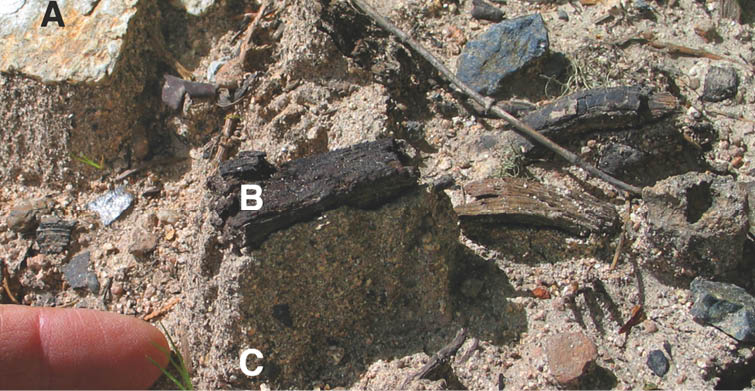
Figure 3-55 | Soils are protected by a soil cover
Larger materials, such as gravels (A) and wood chips (B), protect the soil and sown seeds by absorbing the energy of rainfall impact. While unprotected soil and seeds are removed through splash and sheet erosion, protected soil remains in pedestals, sometimes several inches above the surface of the soil. Seeds that do remain on or near the surface have a difficult time germinating through the surface crust created by rainfall impact (C). Plants that do establish will have roots exposed by successive rainfall events.
Photo credit: David Steinfeld
How to Assess Soil Cover—Soil cover can be measured by establishing transects and recording the percentage of rock, vegetation, litter, duff, and bare soil. A monitoring procedure for measuring soil cover is presented in Section 6.3.1.
Mitigating for Low Soil Cover
The primary objective of most revegetation projects is to stabilize the soil surface and create an optimum environment for seeds to germinate and plants to establish. Initial surface stabilization must remain effective until plants become established and can protect the surface from erosion through vegetative cover. Therefore, the selection of surface stabilization methods must be based on: how effectively does the material stabilize the soil surface, does the material allow good seed germination and plant establishment, and how long does it remain effective (longevity).
Apply an Organic Mulch—A variety of mulches with varying qualities and longevities should be considered based on the erosional potential and revegetation needs of each site (Section 5.2.3). Short-fiber materials, such as wood fiber and paper products found in hydromulches, applied with a tackifier are a very effective short-term surface cover for protecting soil from rainfall impact. However, after a few months, these products are usually no longer effective. Higher rates of hydromulch and tackifier, which make up BFM products, have a higher degree of soil protection and greater longevity (up to a year). On many sites where the environment is optimum for establishing native plants, protection for less than a year is adequate. However, on sites that are cold, arid, or semi-arid, the establishment of vegetative cover can take longer than one year (Figure 3-56) and soil surface protection will require longer-lasting mulches such as straw, pine needles, hay, shredded wood, wood strands, or erosion fabrics.
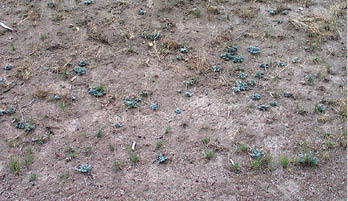
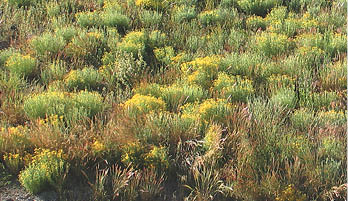
Figure 3-56 | Many sites take more than one year to fully revegetate
Semi-arid, arid, and cold sites often take more than one year to fully revegetate. Photo A shows the vegetative establishment one year after hydroseeding on a semi-arid site; bare soil exceeds 60 percent. Photo B shows the same site almost two years after sowing; vegetation has fully established. Soil cover methods in these cases must last several years for soil protection and plant establishment.
Photo credit: David Steinfel
Apply a Rock Mulch—Gravels, cobbles, and stone can provide a stable soil cover. These materials are often left over after rock has been screen from the soil and designed into the slope can add surface stability and reduce evaporation.
Surface Strength
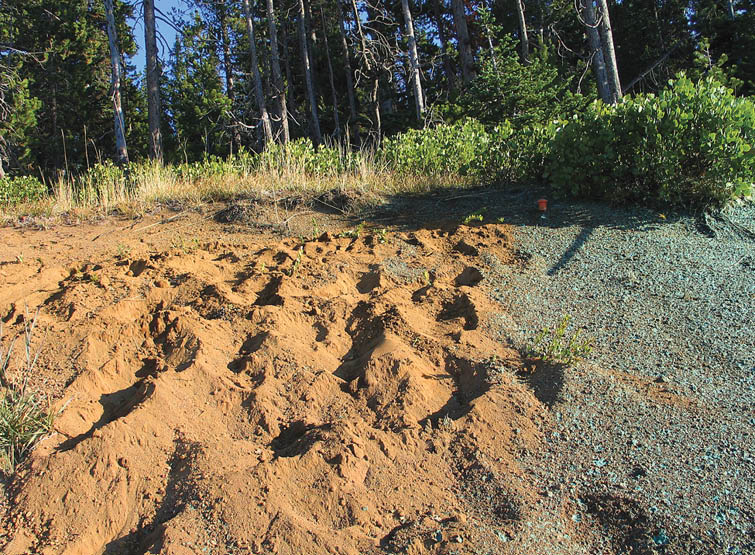
Figure 3-57 | Sandy soils have low surface strength
Soils low in clays and high in sands have very low surface strength. Not only are they prone to surface erosion, but even walking on them can leave the surface in a highly disrupted condition.
Photo credit: David Steinfeld
When soil cover is removed, the surface of the soil is exposed to the erosive forces of raindrop impact, overland flow, freeze-thaw, and wind. How strongly soil particles bind together will determine the degree by which soil particles are detached and moved through soil erosion. Topsoils with good aggregation and high organic matter will be more stable than subsoils or soils low in organic matter. Clay soils have greater strength than soils dominated by sands and silts which are non-cohesive. Seeds have no cohesive properties and, when sown on the surface of the soil without mulches or tackifiers, are very susceptible to erosive forces.
How to Assess Surface Strength—Determining the soil texture of the surface soil is a simple way to determine soil strength (Section 3.8.6, see Soil Strength). Soils low in clays (<15 percent) and high in sands will have low surface strength (Figure 3-57). In most cases, soils lacking topsoil will have reduced surface strength due to the lack of roots and organic matter that hold the soil particles together. The rainfall simulator is an indirect indicator of soil strength because it measures the amount of sediment that is detached from surface soils under various rainfall intensities (Section 3.8.5, see Rainfall). The USDA Natural Resources Conservation Service has developed a field test for determining surface stability for water erosion (Inset 3-4). This method rates how well surface soil samples maintain their stability after being agitated in water.
Inset 3-4 | Bottlecap test for surface stability
From Herrick and others 2005a
Place a soil fragment in a bottle cap filled with water. Watch it for 30 seconds. Gently swirl the water for 5 seconds. Assign one of three ratings:
M = Melts in first 30 seconds (without swirling)—Not stable
D = Disintegrates when swirled (but does not melt)—Moderately stable
S = Stable (even after swirling)—Stable
Mitigating for Low Surface Strength
Apply Tackifier and Hydromulch—Surface strength can be increased for up to a year by applying tackifiers by themselves, with hydromulches, or to bond straw onto the site (Section 5.4.2). These products strengthen the bonds between surface soil particles and between the soil particles and the products. Seeds applied with a tackifier are held tightly to the soil surface, reducing the likelihood that seeds will be detached and moved.
Apply Long-fiber Mulch—Applying a long-fiber mulch to the soil surface can increase the overall surface strength because of the direct contact of the material with the soil surface and the interlocking nature of the fibers (Section 5.2.3). The application of erosion mats can increase surface strength by an order of magnitude when in contact with the soil surface.
Infiltration Rates
Infiltration is the ability of the soil surface to absorb water from rainfall, snowmelt, irrigation, or road drainage. A high infiltration rate indicates that the soil surface can transmit high rates of water; a low rate indicates that the surface has low capability of absorbing water. When infiltration rates are lower than the rate of water input, runoff or overland flow will occur. Under these conditions, runoff can detach and transport soil particles, resulting in soil erosion and, in many cases, off-site water quality problems (Figure 3-58). Overland flow can also remove sown seeds.
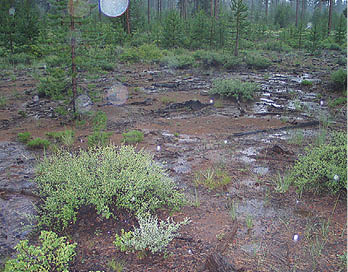
Figure 3-58 | Infiltration rates
When precipitation exceeds infiltration rates, water collects on the surface of the soil and begins to move downslope, causing erosion. On this site, litter and duff layers that typically protect the surface from rainfall impact have been removed, causing low infiltration rates.
Photo credit: David Steinfeld
The size, abundance, and stability of soil surface pores determine the infiltration rates of a soil. Large stable pores created by worms, insects, and channels created by decaying root systems will absorb water quickly and have high infiltration rates, while surfaces that have been compacted, have had their topsoil removed, or are low in organic matter will have poor infiltration rates.
Under undisturbed conditions, infiltration rates are usually high, especially where a litter and duff cover exists. When soil cover is removed, the impact from raindrops can seal the soil surface, creating a crust that will significantly reduce infiltration rates. Infiltration rates are also reduced when soil is compacted by heavy equipment traffic.
How to Assess Infiltration Rates—The most accurate equipment for measuring infiltration rates is the rainfall simulator. This equipment simulates rainstorms of different intensities under controlled conditions and measures how the soil surface responds. Infiltration rates are determined at the point when runoff occurs. The amount of runoff water is measured at the bottom of the plot to calculate runoff rates and sediment yields (Figure 3-59). While most rainfall simulators were developed for agricultural operations, several have been developed specifically for wildland conditions. These simulators were built for transportability and conservation of water because construction sites are often in remote locations and far from water sources. The "drop-forming" rainfall simulator, developed for wildland use, delivers rainfall at the drop size or impact velocity determined for the climate of the project site (Grismer and Hogan 2004).
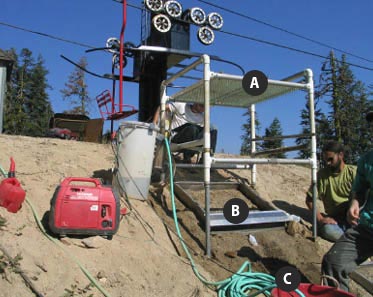
Figure 3-59 | Portable rainfall simulator
A portable "drop-forming" rainfall simulator developed by scientists at the University of California Davis (Grismer and Hogan 2004) delivers water droplets through hundreds of needles (A). Pressure is increased or decreased to simulate rainstorm events. Droplets hit the soil surface within a plot frame (B) and runoff water is collected in a bottle at the bottom of the frame (C) to measure runoff rates and sediment production.
Photo credit: David Steinfeld
Using the rainfall simulator in revegetation planning is expensive, yet it is an important tool and should not be discounted because of the cost. Specifically, rainfall simulation used to compare the effects of different mitigating measures, such as mulches or tillage, on runoff and sediment production takes the guess work out of whether such measures are effective. This quantitative evaluation of erosion control methods might be essential in areas where water quality objectives are critical.
In most cases, infiltration rates are estimated under routine field investigation by inference from site conditions. Infiltration rates can be considered high when the soil surface has not been disturbed and has a high percentage of cover. With compaction and loss of surface cover, infiltration rates are proportionally reduced. It is often assumed that construction activities that remove surface cover or disturb the topsoil will have very low infiltration rates that will create overland flow under most rainfall intensities.
Mitigating for Low Infiltration Rates
Avoid Compaction—Where possible, avoid operating heavy equipment on undisturbed soils or soils that have been tilled. Coordinate with project engineers to verify that site preparation does not compromise the compacted roadbed prism which is engineered as a structural entity.
Tillage—Infiltration rates can be increased through soil tillage (Section 5.2.2) which reduces compaction, increases macropore space, and creates surface roughness. Depending on the erosional characteristics of the site, the positive effects of tillage on infiltration rates might only remain effective through a series of rainfall events.
Incorporating Organic Matter—Incorporating organic matter into the soil surface can increase the longevity of infiltration rates created through tillage by forming stable macropores (Section 5.2.5). Unless macropores are interconnecting or continuous, however, they will not drain well (Claassen 2006). One method for creating continuous pores is to incorporate long, slender organic material, such as shredded wood or hay that overlaps and interconnects within the soil. Higher application rates of shredded wood or straw will result in greater porosity and infiltration rates.
Surface Mulch—Applying surface mulch will reduce the effects of rainfall impact on surface sealing and reduce soil erosion rates (Section 5.2.3). It does not, however, necessarily increase infiltration rates. Studies have shown that, while sediment yield can be less with the application of mulches, runoff rates are not necessarily reduced (Grismer and Hogan 2007).
Plant Cover—The best long-term way to increase infiltration is to create conditions for a healthy vegetative cover. Good vegetative cover will produce soils with extensive root channels, aggregated soil particles, and good litter layers.
Slope Gradient
Slope angle or gradient is important in surface stability because it directly affects how soil particles will respond to erosional forces; the steeper the slope, the greater the erosional forces will act on the surface of the soil. Slope gradient is a dominant factor in water erosion and dry ravel erosional processes. In water erosion, the rate of soil loss and runoff from disturbed soil surfaces increases incrementally as slope gradient steepens. In dry ravel erosion, the surface remains stable until a specific slope gradient is reached, and then soil particles move downslope under the direct effects of gravity. This critical angle is called the angle of repose and it can be likened to the angle that accumulated sands make in an hourglass. Only non-cohesive soils, composed of sands, silts, or gravels, have an angle of repose; soils with significant amounts of clays typically do not.
Dry ravel is the downslope movement of individual particles by rolling, sliding, and bouncing (Rice 1982). It occurs more frequently as soils dry out and is triggered by vibrations from vehicles, animals, planes, and wind turbulence. Dry ravel creates a constant supply of material to the ditches at the bottom of the slopes making these slopes very difficult to revegetate unless the surface is stabilized. Seeds that germinate on steep, raveling slopes typically will not have enough time to put roots down deep enough to stabilize the surface before the emerging seedling moves or is buried by soil particles rolling down from above. Figure 3-60 shows dry ravel on a cut slope composed of a sandy soil.
Figure 3-60 | Dry ravel
Steep, non-cohesive soils move downslope at a continuous rate. The soil surface is constantly moving and never stable long enough for seeds to germinate and plants to become established. These slopes can remain barren for years. Soils that are high in sands and gravels are the most susceptible to dry ravel. In this picture, trees became established below rock outcrops, where the surface was protected from dry ravel.
Photo credit: David Steinfeld
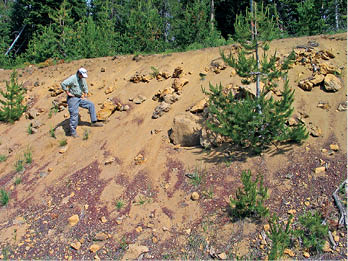
How to Assess Slope Gradient—Slope gradient is quantified in several ways, as shown in Figure 3-61. For road construction projects, slope is usually expressed as the rise (vertical distance) over run (horizontal distance). A 1:3 road cut, for example, defines a slope that rises 1 foot over every 3 feet of distance. Biologists, including range, forest, and soil scientists, use percent slope as a measure of slope angle. This is calculated by measuring the number of feet rise over a 100-foot length. Slope gradient as expressed in degrees is not commonly used.
Slope gradient can be measured in the field using a handheld instrument called a clinometer. This equipment reads slope angle in percent slope and in degrees. Readings from a clinometer can be converted to rise over run notation using the chart in Figure 3-61. Road construction plans display the slope gradients for every cross-section corresponding to road station numbers (refer to Section 2.4 and Figure 2-4). Using these cross-sections, slope gradients can be identified on the plan map by color coding the run:rise for cut and fill slopes. For instance, 1:1 cut and fill slopes might be highlighted red for areas of concern, while those areas with gradients 1:3 or less might be light green, favorable areas for mitigation work. This exercise can quickly identify areas with the highest risk for soil erosion and difficulty in establishing vegetation.
Slope angle plays a key role in revegetation planning because of its potential limitation on the types of mitigation measures that can be implemented. Figure 3-61 shows which practices are generally limited to gentle slopes and which can be implemented on steep slopes.
Figure 3-61 | Revegetation methods and slope gradients
For engineering work, slope is generally expressed as the rise (V) over run (H). For slopes flatter than 1:1, (45° or 100%), slope gradient is expressed as the ratio of one unit vertical to a number of units horizontal. For example a 1:2 slope gradient indicates that there is one unit rise to 2 units horizontal distance. For slopes steeper than 1:1, it is expressed as the number of units vertical to one unit horizontal (e.g., 2:1 indicates that there is a 2 unit rise to 1 unit horizontal distance). In general to avoid confusion, it is wise to notate the ratio by indicating the vertical (V) and horizontal (H), when defining gradient (e.g., 2V:1H). Range and forest sciences use % slope gradient to describe slope angle. Slope gradient refers to the number of feet elevation rise over 100 feet. A 66 percent slope gradient indicates that for every 100 feet, there is a 66 foot vertical distance rise. Slope gradient controls what type of revegetation treatments can be used (B). The steeper the slope gradient, the fewer tools are available.
Mitigating for Steep Slope Gradients
Lengthen Cut or Fill Slopes—Slope gradient can be reduced by increasing the length of the disturbance. This will make the revegetation effort easier and more successful, but will increase the amount of area, or construction footprint, of the project.
Road planners consider many factors when they design the steepness of cuts and fills. A common strategy is to create cut and fill slope gradients as steep as possible. This practice disturbs far less land, resulting in less area to revegetate, and because there is less exposed soil, the potential for soil erosion is considerably reduced. Furthermore, there is a substantial cost savings with less excavation and revegetation work. Figure 3-62 shows an example of how increasing the steepness of a cut slope on a typical 1V:2H natural ground slope substantially decreases the length of disturbed soils.
Figure 3-62 | Effects of designing steep and gentle gradient slopes on size of disturbance
The trade-off between designing steep cuts that are difficult to revegetate or creating gentle slopes that disturb more area but are easier to revegetate is demonstrated in this example. The centerline (A) of a new road intersects the 1V:2H natural ground (A to D). Fifteen horizontal feet of material must be excavated from the center of the road (A) to the ditch (B) to create the road bed. The resulting road cut will have varying lengths depending on how steep it is designed. A 1:1 cut slope will expose a 25 ft cut from the ditch (B) to the top of the cut slope (C). A 1V:1.5H slope (B to D) will lengthen this exposure threefold to approximately 80 ft. A 1V:2H slope (B to E) is not achievable because it remains parallel to the natural ground slope.
The main drawback of steepening slopes from a designer's standpoint, however, is that steeper slopes are much harder to revegetate and the selection of revegetation practices available are reduced as the steepness of the slope increases. Vegetation on steeper slopes are also harder to maintain using practices such as mowing. On sites with 1V:5H slopes or less, all revegetation practices are possible; on slopes approaching 1:1, the threshold of most revegetation practices has been reached, as well as the limit of what can be successfully revegetated. It is important to work with the design engineers early in the planning stages to consider the effects of slope gradient on meeting revegetation objectives.
Create Steep, Hardened Structures—Creating hardened structures or walls, such as retaining walls, crib walls, gabion walls, mechanically stabilized earth walls, or log terrace structures at the base of a steep slope, will allow gentler slope gradients to be constructed above the structure. With adequate planning, these structures can be revegetated.
Surface Roughness
Slopes that have roughened surfaces trap water during the initial stages of runoff (Darboux and Huang 2005). Roughened surfaces consist of microbasins that capture and store soil particles and seeds that detach in the erosional processes. Seeds that have been transported short distances into these depressions are often buried by sediments. Moderate seed covering from transported soil can enhance germination as long as the seeds are not buried too deeply. Microbasins can also be relatively stable during the period for seed germination and seedling establishment.
Surface roughness also reduces the effects of wind by reducing wind speed at the soil surface. Seeds may be blown into the depressions and become covered by transported soil. For both wind and water erosion, however, as the microbasins fill up with sediments, they become less effective in capturing sediments and seeds (Figure 3-63).
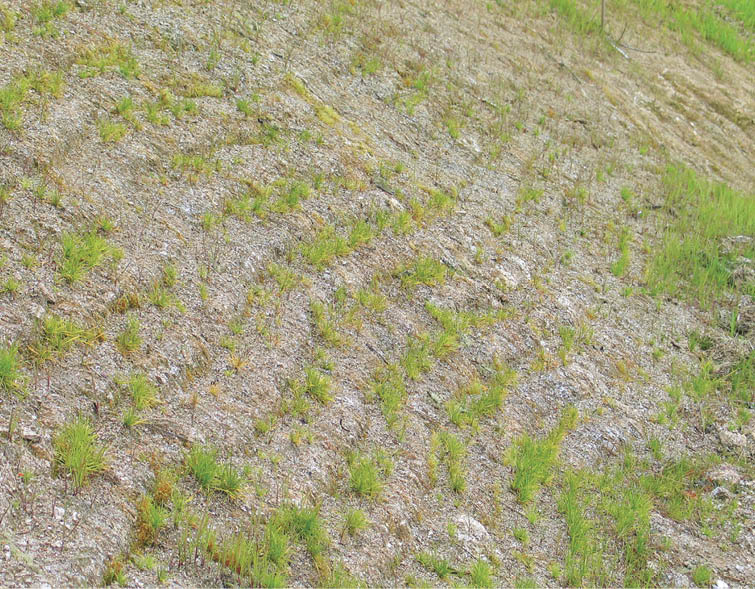
Figure 3-63 | Surface roughness creates favorable environment for germination
Surface roughness consists of microbasins that are favorable to seed germination and early plant establishment.
Photo credit: David Steinfeld
How to Assess Surface Roughness—The simplest method for assessing surface roughness is to take several measurements of the distance between the top and bottom of the microbasin and average these values. Also count the number of microbasins in a 5-foot distance perpendicular to the slope direction. Shallow, closely spaced microbasins may create more area for seed germination but will also fill up faster with sediments, while microbasins that are deeper and farther apart will take longer to fill up and be more effective for erosion control but may have less surface area for optimum plant establishment from seeds.
Mitigation for Smooth Soil Surfaces
Leave Surface Roughened—Many project engineers have a tendency to "beautify" construction sites at the end of a road project by smoothing soil surfaces. While basic landscape shaping is essential, it is important to keep the soil surface as rough as possible. In many instances, leaving cut slopes "unfinished" or in the "clearing and grubbing" stage provides excellent seed bed diversity and growing environment. The diversity of micro-habitats provides greater climatic and soil environments for seed germination. An exception to this rule is where erosion control matting is used for slope stabilization. For the matting to function best, it needs complete contact with the soil surface. On roughened surfaces matting will "tent" over depressions. On smooth surfaces the correctly installed matting will contact the soil surface, hold seeds in place and stabilize the slope soils.
Surface Imprinting—Imprinting the soil surface to create micro-relief has been shown to be effective in reducing runoff and soil erosion and increasing plant establishment (Section 5.2.2, see Roughen Soil Surfaces).
Tillage—Tilling the surface soil layers will leave the site in a roughened condition (Section 5.2.2). This practice can have other beneficial effects on the soil, such as loosening compacted soils.
Slope Length
Another factor influencing soil erosion and seed transport is the length of slope. As the slope lengthens, so does the potential for transport of sediments and seeds. On very long slopes, the erosive force begins as sheet erosion at the top of the disturbance and often turns into rills and, in extreme cases, gullies at the bottom of the slope (Figure 3-64).
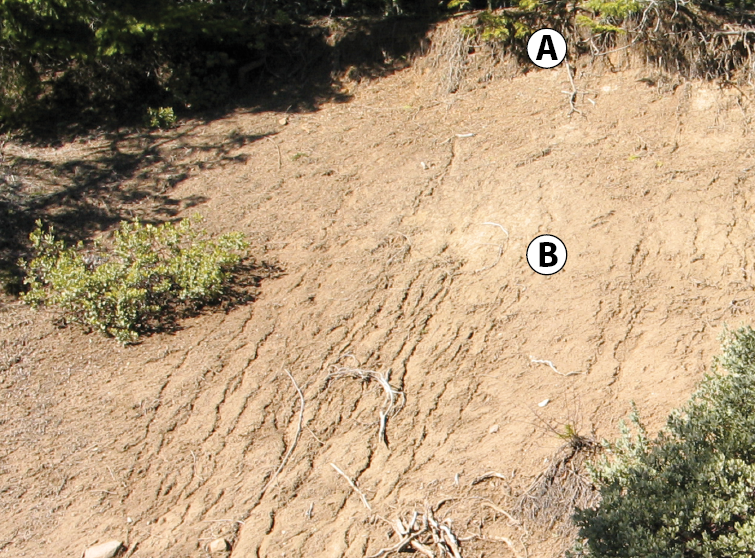
Figure 3-64 | Surface erosion increase with distance downslope
On this site, sheet erosion occurs at the top of the slope (A) and turns to rill erosion (B) as runoff collects. Mitigation that shortens slope lengths to less than the distance between A to B will reduce rill erosion.
Photo credit: David Steinfeld
How to Assess Slope Length—Slope length can be measured in the field or from road plans. From road plans, slopes can be grouped into different lengths using the road cross sections (see Chapter 2). In the field, the effects of different slope lengths can be assessed by observing erosional features on existing disturbed areas. New or old disturbances can be used as references for critical slope lengths. Figure 3-64 demonstrates that at some point downslope rills begin to form. The distance that this occurs is the maximum length of slope for this slope angle and soil type before severe erosion takes place. This distance will vary by other factors addressed in this section (e.g., soil cover, climate, slope gradient, surface strength, surface roughness, and infiltration rates).
Mitigating Measures for Long Slopes
Install Barriers—Fiber rolls, straw wattles, downed wood, silt fences, or compost berms or compost socks can be laid on the surface as obstructions or barriers to reduce slope length. To be effective, they must be placed in contact with the soil and perpendicular to the slope gradient. Straw wattles, hay bales, and silt fences must be trenched into the soil.
Create Benches—The creation of slope breaks can reduce slope length. These breaks include benches, steps, or trenches cut into the slope. The reduced gradient at these breaks slows the velocity of overland flow and collects sediments (Figure 3-65).
If either practice is applied in a long continuous line, they must be constructed on contour to the slope. If they are not level, water can collect and move along the structure, much like a channel, and eventually spill onto the slope below, creating rills and gullies. (The exception to this is the construction of live pole drains to redirect water off-site for slope stability [Section 5.4.3, see Live Fascines]). When placed properly along the contour, slope distances are shortened and the structures collect sediments and create areas for plant growth. Plants that are grown above barriers or near the bottom edge of benches can take advantage of water and sediments that collect during rainstorms. Native vegetation can be incorporated into many of these designs to take advantage of increased soil moisture and sediment accumulation. The distance that these structures are placed apart from each other should be less than the critical distance where rills are expected.
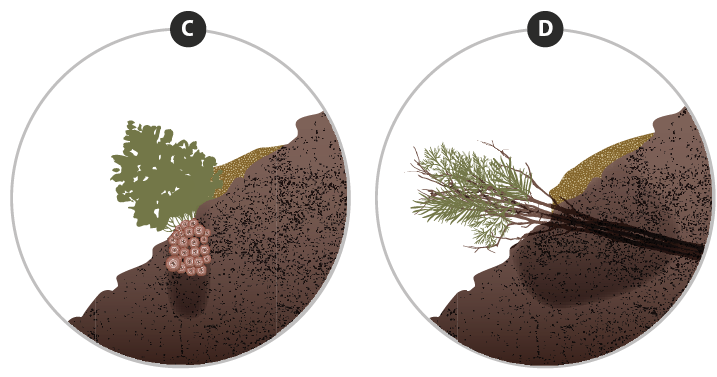
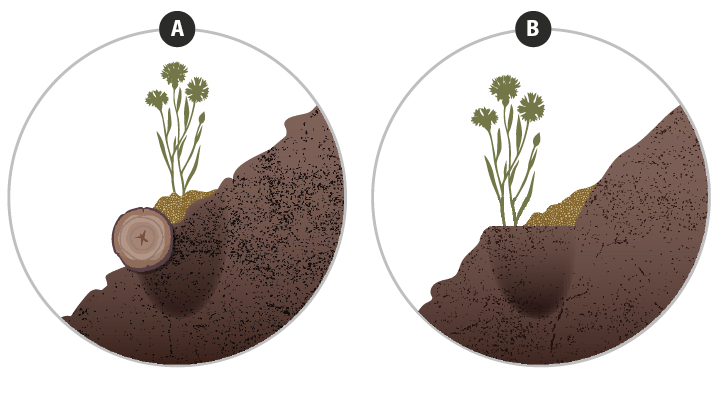
Figure 3-65 | Structures that shorten slope length
Structures that shorten the slope length can slow surface runoff, collect sediments and increase soil moisture. Typical treatments include: a) placement of fiber rolls, logs, straw waddles, and compost berms; b) benches, steps, and trenches; c) willow waddles; and d) willow brush layers. Strategic placement of plants can take advantage of increased soil moisture by planting where roots can access the additional moisture. Most species do not respond well to being buried by sediment and should be planted above or below depositional areas (A and B). However, some species, such as willow, root where the stems are buried, and these species can be planted where sediments are expected to be deposited (C and D).
3.8.6 Slope Stability
This discussion is directed to non-engineers to simplify and make accessible basic slope stability concepts that must be understood in developing revegetation strategies. It is by no means a substitute for professional engineering expertise. Technical references for slope stability are many (including Carson and Kirby 1972; Spangler and Handy 1973; Brunsden and Prior 1984; Denning and others 1994), to which the reader is referred for a comprehensive review of this subject. For a detailed evaluation of the role of vegetation in slope stability, the reader is referred to Gray and Leiser (1982).
Creating stable slopes is essential for establishing healthy plant communities, but the reverse is equally true—establishing native vegetation is critical for stabilizing slopes. The following discussion takes the latter perspective of how to create the most favorable environment for establishing vegetation on potentially unstable slopes and how this approach can be integrated into the overall strategy of slope stabilization. A vegetated slope adds stability to slopes by holding the soil together through a network of root systems and by removing water from the soil, which is the primary driving force behind most landslides.
Slope stability is the resistance of natural or artificial slopes to fail through gravitational forces. The landforms resulting from slope failures are called landslides and they are described by their morphology, movement rates, patterns, and scale. This section will focus on two general types of landslides that are common to road cuts and fills—slumps and debris slides (Figure 3-66). Slumps typically occur on deep soils that are cohesive (e.g., rich in clays). They tend to be deep seated and slow moving. Viewed in profile, the failure occurs in a circular motion, resulting in a series of tilted blocks and circular cracks. Debris slides are shallow, fast-moving landslides that form on non-cohesive soils (e.g., sandy, gravelly). These landslides occur on steep slopes.
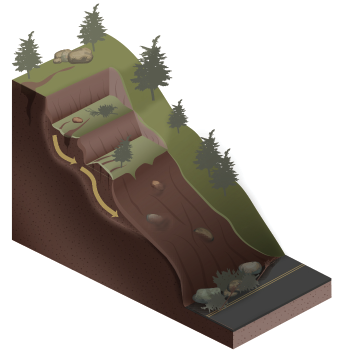
Slumps
- Moderate slope gradients
- Circular failure movement
- Cohesive soils
- Deep soils
- Slow moving
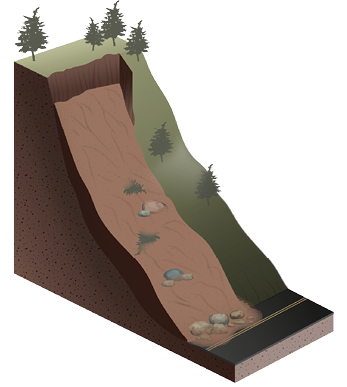
Debris slides
- Steep slope gradients
- Planar failure movement
- Noncohesive soils
- Shallow
- Fast-moving
Figure 3-66 | Slumps and slides
Common landslides typically associated with road construction.
Modified after Varnes (1978) and Bedrossian (1983)
Water is the driving force behind most slope stability problems encountered in road projects. It comes as rainstorms, snowmelt, and often as diverted surface water from road drainage. As water increases in a potentially unstable slope, the added weight of the water in the soil plus the increased pressure of water in the pores (pore water pressure) eventually exceeds the strength of the soil and the slope fails (Figure 3-67).

Figure 3-67 | Water pressure and slope stability
Water pressure is greatest when soils are saturated. Slopes release this pressure through channels created by decomposing roots, animal burrows, and worm holes. When pressures become greater than the strength of the soil, slopes fail. This picture of a decomposed root releasing water pressure was taken 30 minutes before the road cut failed.
Photo credit: David Steinfeld
Increased water to a slope is especially a problem where a restrictive layer (e.g., a layer of soil that limits water movement) is close to the soil surface. As water moves through the surface horizon and encounters a restrictive layer, it builds up in the pores of the horizon above it, increasing water pressure. The saturated horizon becomes heavier and eventually the slope fails under the added weight of water and increased pore water pressure.
The faster water moves through soil, the less susceptible a slope is to failure. The measured rate at which water is transmitted through a soil mass is its permeability. When permeability is high, water quickly moves out of the soil pores, reducing the potential for increased pore water pressure and slope weight. When permeability is low, water slowly moves through soil and builds up in the soil pores. On gentle slopes, this is typically not a problem, but as slope gradients increase, gravitational forces acting on the slope raise the potential for slope failure. Slope length is another factor important to water movement because the longer the slope, the greater the buildup of water near the base of the slope. This phenomenon explains why many slope failures occur in the mid to lower portions of fill slopes.
Whether a slope fails or not is ultimately due to the strength of the soil. Soil strength is affected by the amount of clay present in the soil, the level of compaction (the greater soil compaction, the more stable the soil), and the presence of roots (more roots are better). Compaction of soils to increase soil strength usually takes priority in road design over creating optimum soil conditions for root growth. With this practice, not only are there fewer root systems to add slope stability, there is also reduced vegetative cover, which is important for intercepting and removing water from the soil. A road design that integrates vegetation into the stability of the slope can meet both road and revegetation objectives, but it will take a collaborative approach.
This section will discuss each of the following parameters as they relate to increasing slope stability through revegetation treatments:
- Permeability
- Restrictive layers
- Water input
- Slope length
- Slope gradient
- Soil strength
Permeability
The rate at which a volume of water moves through soil material is its permeability (technically referred to as hydraulic conductivity). Soils that have moderate to high permeability rates tend to be more stable than those with low permeability rates. Where permeability is low, water fills the soil pores but does not drain quickly, adding additional weight to the slope and increasing the pore pressure. Both factors reduce the overall strength of slopes and increase the likelihood that slope movement will occur when other conditions are right.
Soils with large interconnecting pores have a higher permeability than soils with smaller pores that are less interconnecting. Soil textures that are well-graded (soils that have only one particle size) typically have a higher permeability than poorly graded soils (soils having a range of particle sizes from clays to small gravels). For example, poorly graded granitic soils have low permeability rates because the different-sized particles are neatly packed together, restricting the pathways for water flow. Well-graded soils, such as pure sands and gravels, have high permeability because pores are large and interconnecting. Alternatively, compacted soils often have low permeability rates because of the reduced or destroyed interconnecting macropores.
How to Assess Permeability—Simple field tests, such as percolation tests, historically utilized in assessing septic leach fields, can be used for determining permeability rates. A small hole is excavated and water is poured to a specified depth. The time to drain the water from the pit is measured in inches per hour.
These tests are run at different soil depths to determine if permeability rates change. Results from percolation tests are subject to significant variability. Nevertheless, they can indicate the relative permeability of different soil types or different soil disturbances.
Engineering laboratory tests for determining permeability include the constant head permeameter for coarse-grained soils. In this test, a soil sample is placed in a cylinder at the same density as the soils in the field. Water is introduced and allowed to saturate the sample. A constant water elevation, or head, is maintained as the water flows through the soil. The volume of water passing through the sample is collected and this provides a direct measurement of the flow rate per unit of time. The test can be repeated at various densities to determine the corresponding permeability. The test can also be repeated for various additions of organic amendments and compaction levels to determine the effects of these treatments on permeability. A soil lab should be consulted for how to collect and submit samples for these tests.
Where testing is not feasible, engineering and soil texts can give ranges for expected permeability based upon the soil gradation and classification. A field assessment can also give some indication of permeability rates. Subsoils or soils lacking organic matter that have a range of soil particle sizes, from clays through small gravels, have a propensity for low permeability rates, especially when they are compacted (Section 3.8.2, see Soil Structure).
Mitigating for Low Permeability
Tillage—Loosening compacted soil through tillage practices (Section 5.2.2) increases permeability by creating large fractures or pathways for water to flow. However, tilled soils often return to near-original permeability as the soils settle over time.
Organic Amendments—Long-fibered organic matter, such as shredded wood, tilled deeply into the soil will increase the infiltration and permeability of the soil because larger, interconnecting pore spaces are created (Section 5.2.5). Several studies evaluating the incorporation of unscreened yard waste suggests that an optimum rate of organic matter additions for increasing infiltration and improving soil structure is approximately 25 percent compost to soil volume (Claassen 2006). In addition, incorporating organic matter can increase slope stability because amended soils are lighter in weight than non-amended soils (mineral soils can weigh 10 to 20 times more than soils amended with 25 percent organic matter). The reduced soil weight lowers the driving forces that create unstable slopes.
Restrictive Layer
A restrictive layer is any soil horizon or stratum (including unfractured bedrock) that has very low permeability. As water flows through a surface horizon with good permeability and encounters a restrictive layer, the rate of downward water movement slows and water builds up in the pores above. The boundary between the permeable surface layer and the harder subsurface material is often a zone of weakness, sometimes referred to as a slip plane. Slope failure occurs when the pores in the soils above the restrictive layer become saturated with water to a point where the pore water pressure and soil weight exceed the soil strength. The depth of slope failure depends on the thickness of the soils above the restrictive layer. On slopes where the restrictive layer is near the surface, slope failure, if it occurs, will be shallow (Figure 3-68). Where the contact is deeper, the soil movement will be more extensive. The types of landslides that occur with restrictive layers are debris slides.
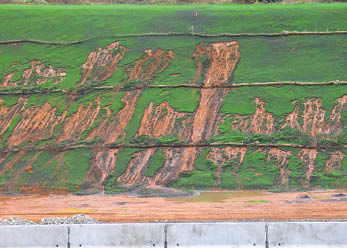
Figure 3-68 | Restrictive layers can decrease slope stability
In this photograph, a restrictive layer is very close to the soil surface. During a rain storm, water moved through the shallow soil layer and encountered a restrictive layer. Water then moved downslope, through the soil, building up pressure, until the increased pore pressure and soil weight exceeded the strength of the soil. At this point, the mid to lower slopes failed.
Photo credit: David Steinfeld
How to Assess Restritive Layers—Restrictive layers in natural settings can be inferred by the presence of seeps and springs. These features occur most often at the point where a restrictive layer is intercepted or exposed to the surface. These can be intermittent features that are observed in the winter or spring but are dry in the fall or summer. The vegetation around permanent and temporary seeps and springs is typically composed of water-loving species, such as sedges (Carex spp.) and rushes (Juncus spp.). Figure 3-69 shows how a seep is created when a cut slope intersects a restrictive layer.
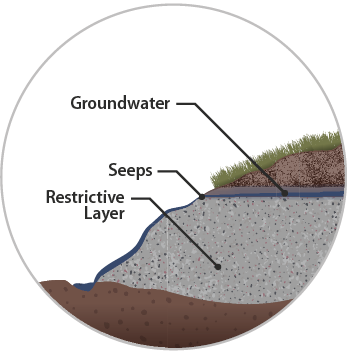
Figure 3-69 | Restrictive layers and ground water
Groundwater moves downslope above restrictive soil layers. Seeps are seen in road cuts where the restrictive layer is exposed. Increased soil water that occurs above restrictive layers can decrease slope stability.
On construction sites, restrictive layers can be created by placing a loose soil or compost over highly compacted subsoil. These layers can be identified in the field by determining soil strength using a soil penetrometer or shovel to find compacted or dense soils (Section 3.8.6, see Soil Strength). On roadbed fill slopes or road cut slopes the compaction of the soils can be assumed. This layer is then assessed for the approximate amounts of silt and clay using the field texturing method. Dense or compacted soil layers that are high in silts and clays are likely to be very restrictive to water movement. Field permeability tests can be used to determine the rates of water flow (Section 3.8.6, see Permeability). Often restrictive layers are not observed until after construction when they manifest as intermittent seeps or wet areas in cut and fill slopes. Geotechnical investigation will determine if these features are due to shallow water movement associated with restrictive layers or interception of deeper subsurface water.
Mitigating for Restrictive Layers
Tillage—If restrictive layers are within several feet of the soil surface, site treatments that break up portions of this layer can increase permeability, which will increase stability. Site treatments that accomplish this are bucket tillage, deep ripping, spading, and fill cut (benching and backfilling), which are discussed in Section 5.2.2. The drawback to tillage is that it will reduce soil strength in the short term until roots occupy the soil and increase soil strength. Temporary irrigation systems have been installed on sites where quick establishment of grass cover during summer and fall is essential for slope stabilization prior to winter precipitation (Hogan 2007). Tillage techniques that leave a deep uneven subsurface profile reduce the potential for downslope debris slides.
Organic Amendments—Where possible, the incorporation of organic matter will help keep the restrictive layer from returning to its original soil density and allow more time for roots to establish (Section 5.2.5). As described above, soil strength is reduced until vegetation becomes established, but the negative effects of reduced soil strength are offset by the increased permeability and reduced soil weight of the organic amendments.
Key-In Surface Material Installations—Installation of straw wattles, staked in place on contour, prior to installation of topsoil or compost can hold permeable surface layers in place long enough for plant root systems to knit the layers together. Fully biodegradable wattles should be used.
Live Pole Drains—Live pole drains are constructed to intercept water from seepage areas and remove it through a system of interconnecting willow bundles to more stable areas, such as draws, ditches, or other waterways (Figure 3-70). The interception and flow of water encourages the establishment and growth of willow cuttings along the length of the live pole drain.
Figure 3-70 | Live pole drains
Slumps are characterized by scarps, cracks, and benches. Water collects on benches and in cracks where it is transmitted into the slide mass, creating continued instability. Slopes can be stabilized by removing water through a series of hand-dug surface ditches. Using the cracks as guides for the location of ditches, they are filled in with soil and dug wide enough for a willow fascine (Section 5.4.3, see Live Fascines) to be placed in the bottom (A). Called "live pole drains" (Polster 1997), these structures not only quickly move surface water from the slide to more stable areas, but the willow cuttings in the fascines, encouraged by the presence of high soil moisture, grow into dense vegetation (B) that stabilize the slide through the deep rooting and dewatering.
Photo credit: David Steinfeld
Water Input
Water, which is the driving force behind most landslides, comes through rainfall, groundwater flow, snow melt, or diverted from other areas through road drainage. Landslides often occur after a series of strong winter storms have delivered a high amount of rainfall over a short period of time. Under these conditions, soils have not had sufficient time to drain before the next storms arrive and water in the soil builds up to a very high pressure (Figure 3-67). With additional storms the combination of increased pore water pressure and additional weight of water in the slopes eventually leads to slope failure. Landslides can occur where water from road ditches or other road features drain water onto marginally unstable slopes. Major site factors that affect water input are rainfall duration and intensity, rain-on-snow events, and road drainage.
How to Assess Water Input—See Section 3.8.1 for how to assess water input.
Mitigating for High Water Input
Proper Surface Drainage—Increased water is the driving force behind slumps and debris slides. Designing proper water drainage is probably the most important measure to implement for slope stability (Gedney and Weber 1978). Where road water is inadvertently routed into potentially unstable areas, there is a greater potential for slope failure (Fredricksen and Harr 1981). Road projects that are designed to move storm water away from or out of unstable slopes as quickly as possible through road and slope drainage structures increase slope stability. In some cases, installing a curb at the top of the cut slope will effectively move water away from unstable slopes below. Coordinate with engineers to ensure that surface runoff, during construction of phased projects, is addressed prior to completion of final storm water system.
Species Selection—Select species that have adapted to wet soils. These include sedges (Carex spp.), rushes (Juncus spp.), bulrushes (Scirpus spp.), willows (Salix spp.), cottonwoods (Populus spp.), and cedars (Thuja spp. and Chamaecyparis spp.). Because each species has a unique way, or strategy, of modifying the moisture regime of a site, planting a mixture of species is a way of ensuring that all strategies are represented on the site. For instance, willows establish quickly and can draw large quantities of moisture from the soil, but only when the willows have leaves. Cedars, on the other hand, are slower to establish, but longer lived. They can withdraw moisture from the soil during the winter, unlike deciduous species. When they are well established, they intercept large amounts of water in the crowns, preventing precipitation from reaching the soil. Trees have a great ability to significantly deplete moisture at considerable depths (Gray and Leiser 1982). Wetland species, such as rushes and sedges, unlike many tree and shrub species, grow well in saturated soils.
Live Pole Drains—The live pole drain (Polster 1997) is a biotechnical engineering technique where continuous willow bundles (Figure 3-70) are placed across a slope, much like an open drain, to redirect water to a more stable area, such as channels and draws. Where small slump failures have occurred during or after construction, live pole drains can be installed to increase slope drainage, add root strength, and remove soil moisture from the slide mass.
Slope Length
Slope length is important for stability because the longer the slope, the more water concentrates in the lower portion of the slope. Increased water increases pore water pressure and soil weights, thereby decreasing the stability of the mid to lower sections of long slopes. This is one reason why slumps are often observed in the mid to lower slope positions of longer fill slopes.
How to Assess Slope Length—Slope length can be obtained from road plans or measured directly in the field using a tape.
Mitigation for Long Slopes
Live Pole Drains—Using live pole drains (discussed in the previous section), shortens the distance water is transmitted through the hill slope by intercepting surface and subsurface water in ditches at frequent slope intervals. Captured water is transmitted downslope through a system of continuous fascines to a stable channel (Figure 3-70).
Create Benches—Another method of reducing slope length can be the creation of a slope break, such as benches, steps, or trenches cut into the slope. The reduced gradient at these breaks slows the velocity of overland flow and collects sediments. However, unless the water is directed off the slope, total water input to the slope is not reduced.
Slope Gradient
As slope gradient increases, the destabilizing gravitational forces acting on the slope become greater. On a level surface, the gravitational force stabilizes the soil mass but as gradients increase, the strength of the soil mass to resist sliding along the failure plane decreases.
How to Assess Slope Gradient—Assessing slope gradient is discussed in Section 3.8.5, see Slope Gradient.
Mitigating for Steep Slopes
Mitigating measures for steep slopes are discussed in Section 3.8.5, see Slope Gradient.
Soil Strength
Soil strength (technically referred to as shear strength) is the characteristic of soil particles to resist downslope forces. Physical and biological factors play roles in soil strength. The major physical factors contributing to increased soil strength are reduced porosity (compacted soils), greater range of particle sizes (poorly graded soils), greater angularity of the soil particles, greater surface roughness, and the presence of silts and clays that add cohesive strength (Hall and others 1994).
The biological components of increased soil strength are the matrix of roots that reinforce the surface horizon, roots that anchor an unstable soil mantle to stable subsoils or rock, and stems (e.g., trunks of trees) that add support to the soil immediately uphill (Hall and others 1994) (Figure 3-71). The physical factors, unfortunately, do not always support the biological factors. For example, high porosity soils are of particular interest to the designer because of the role porosity plays in root growth. From an engineering standpoint, however, high porosity soils have lower soil strength because soil particles are not packed closely together and are less interlocking. Balancing the needs of creating a healthy soil for optimum vegetation while still maintaining slope stability until established vegetation adds root strength to the soil is a challenge to engineers and revegetation specialists. A road design that creates soils with high porosity will also decrease soil strength in the short term; however, if this practice increases the biological productivity of the site, the long-term result is a net increase in soil strength (Gray and Leiser 1982). The growth habits of native species can greatly influence slope stability because each species has a unique rooting pattern and root tensile strength. For instance, grass roots are very fibrous and abundant in the surface horizon, adding surface stability when the grass cover is high. Grass and forb roots, however, add very little soil strength at deeper depths because their roots are not as strong and do not penetrate as deeply as tree roots (Gray and Leiser 1982). Alternatively, roots of shrub and tree species are long and deep rooted, with relatively high tensile strength (Gray and Leiser 1982). The main advantage of tree and shrub species is the long vertical roots (taproots) that can cross failure planes and bind the soil strata together (Figure 3-71).
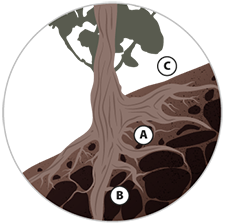
Figure 3-71 | Plant roots and slope stability
Plant roots and stems increase slope stability by (A) reinforcing the surface horizon through a matrix of roots, (B) anchoring surface horizons to rock or subsoils, and (C) stems supporting the soil upslope.
How to Assess Soil Strength—The designer will probably not perform engineering tests for soil strength, yet knowing a little about these tests could be important, especially if the designer is making recommendations that soils on potentially unstable sites be deeply tilled or amended with organic matter.
A common method engineers use to estimate soil strength is to correlate soil classification (from sieve analysis and the characteristics of clay particles) with published literature values. Shear vanes or cone penetrometers are good methods to approximate the strength of fine-grained soils in the field, and published research is used to correlate these readings with laboratory shear strength test results.
The triaxial shear test is a more precise laboratory method to determine shear strength of soils. In this test, a long cylinder of the soil is placed in a latex membrane and submerged in a clear plastic cylinder filled with water. A vertical pressure is applied to the cylinder at a slow rate until the soil sample shears. Very sensitive strain gauges measure the soil displacement, applied forces, and any pore water pressures that develop. Various water pressures are applied to the cylinder to simulate the confining pressure of soil depth (Brunsden and Prior 1984). This test can be used to determine the shear strength of soils that have been amended with organic materials.
Mitigating for Low Soil Strength
Biotechnical Engineering Techniques—Many biotechnical slope stabilization techniques use vegetative cuttings from willows or other easy-to-root species to structurally reinforce the soil. As these materials root, they add further stabilization to slopes through interconnecting root systems and soil moisture withdrawal. These practices include stake planting, pole planting, joint planting, brush layers, and branch packing (Section 5.4.3).
Shrub and Tree Seedlings—On drier sites, where willow cuttings are less likely to survive and grow, shrub and tree seedlings can be used. While these species are slower growing, they usually have deeper root systems and persist longer once they are established. Grass and forb species can quickly establish on drier sites, but soil strength is limited to the surface of the soil profile where the roots are most abundant. For this reason, grasses and forbs do not provide as much stability (Figure 3-72). On potentially unstable sites, grasses should be grown between shrub and tree seedlings to add soil strength to the surface soil while tree and shrub species become established. On dry sites, however, grasses must be excluded around seedlings or vegetative cuttings until they have become established. Because of the steep, shallow nature of many of these sites, planting seedlings is not always practical or successful. Hydroseeding or hand sowing, covered by a surface mulch that will protect the surface from erosion for several years while the shrubs become established, should be considered.
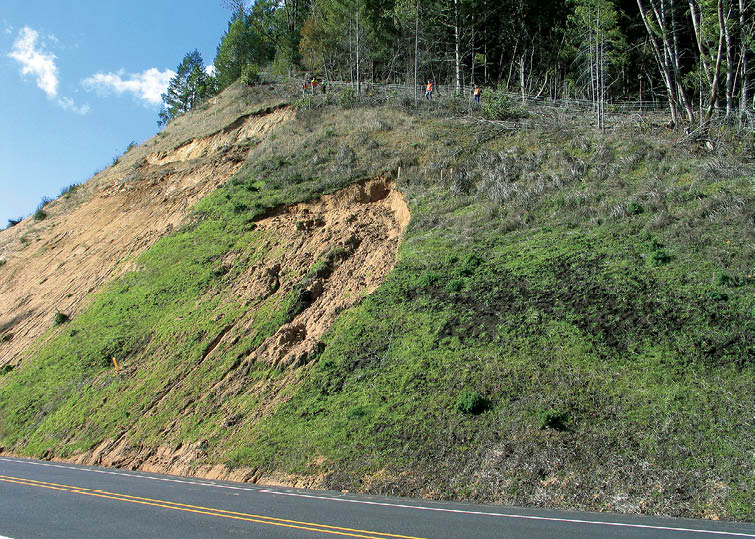
Figure 3-72 | Effects of roots on slope stability
This debris slide (noted by its shallow, steep appearance) took place two years after construction when the grass and forbs were fully established. Establishing shrub species, rather than grass and forb species, on steep, potentially unstable slopes, would be better for long term stability because shrub species are deeper rooting and have higher root tensile strength.
Photo credit: David Steinfeld
Soil Improvement—Improving soil productivity will increase root densities and enhance slope stability (Hall and others 1994). Mitigating measures that improve water storage, organic matter, and nutrients should, with time, increase slope stability. Some practices, such as soil tillage, reduce soil strength in the short-term. However, once plants have become established more roots occupy the soil and slope stability is increased. Tillage should be integrated with practices that quickly reestablish vegetation to ensure that slope stability is not compromised in the short term. On slopes where root strength is critical for stability in the first year after construction, irrigation could be considered to quickly establish a dense vegetation cover.
Temporary Soil Stabilization—It is important to implement erosion control practices that stabilize the surface of steep slopes while vegetation develops a strong root system and top growth. Where trees are inappropriate because of clear zones and shrubs inappropriate because of sight lines, erosion control products work well to stabilize soils while grasses and forbs establish.